
Markets rarely move in straight lines. January’s volatility was a reminder that positioning, narratives, and macro noise can overwhelm fundamentals – until they don’t. In this note, we revisit why we see India’s momentum is improving as tariff overhangs ease, reforms compound, and the China+1 opportunity reopens. We also explore the “great AI rotation”, as attention shifts from infrastructure winners to adopters capturing measurable efficiency gains. In periods like this, discipline matters: sell-on-rise where exuberance is priced in, and buy-on-dips where pessimism is excessive. For us, India is clearly the latter.
Indian equities pulled back in January, with the MSCI India Index declining 5.09% (in USD terms1). All sectors ended lower, with Real Estate and Energy the worst performers, while Materials and Information Technology were the relative outperformers. Foreign portfolio investors (FPIs) continued their selling streak, withdrawing approximately USD 4.0 billion from Indian equities in January, extending the trend that saw nearly USD 18.9 billion of net outflows in 2025.2
The sell-off reflected a confluence of headwinds. The Indian rupee weakened to record lows near 92 per dollar, compounding negative return expectations for foreign investors. Continued uncertainty around the US-India trade relationship and the 50% tariff overhang on Indian exports weighed on sentiment, while the pre-Union Budget cautionary mood added another layer of hesitation. Mixed Q3 FY26 corporate earnings, with downgrades to consensus estimates across large-cap financials, IT, and consumer staples, also dampened sentiment. Finally, global investor attention remained concentrated on AI enablers and infrastructure plays, which further diverted flows and left Indian equities out of favor during the month.
However, beneath the market weakness, domestic activity indicators remain robust. Manufacturing purchasing managers’ index (PMI) rebounded to 55.4 in January (vs 55.0 in December), supported by stronger domestic demand and a pickup in new orders.3 Services PMI rose to 58.5 (vs 58.0 in December), driven by stronger new business inflows and buoyant demand, especially from international clients.4 Bank credit growth accelerated to 14.5% y/y at end-December, the fastest pace in recent quarters, driven by festive-season spending, GST rate rationalization, and a pickup in wholesale credit demand as RBI rate cuts transmitted through the banking system.5 Auto retail sales also closed calendar year 2025 on a strong note, surging 14.6% y/y in December, with the full-year registering 7.7% growth to 28.2 million units.6 January auto wholesale volumes continued this momentum, with industry-wide passenger vehicle dispatches hitting their highest-ever January level, underscoring the strength of underlying consumer demand.
On the inflation front, headline consumer price index (CPI) edged up to 1.33% y/y in December (vs 0.71% in November), extending the normalization from October’s record low but remaining well below the Reserve Bank of India’s (RBI) 2-6% tolerance band. Food prices, which account for nearly half of the consumer basket, remained in deflation at -2.71% y/y, reflecting the continued benefit of strong agricultural output and GST rationalization on staples. Core CPI (excluding food and beverages, fuel and light, and petrol and diesel), however, firmed to a 28-month high of 4.8% in December (vs 4.4% in November), driven largely by elevated precious metal prices; stripping out gold and silver, core CPI was unchanged at a benign 2.4%.
In a significant development for India’s trade architecture, India and the European Union (EU) concluded negotiations on a landmark free trade agreement on January 27, creating a free trade zone encompassing two billion people and approximately 25% of global GDP.7 The deal, which was nearly two decades in the making and described by both sides as the “mother of all deals”, will progressively eliminate or reduce tariffs on 96.6% of EU goods exports to India, spanning machinery, chemicals, pharmaceuticals, and aircraft, while granting EU service providers privileged access to Indian financial and maritime sectors. For India, the agreement opens the EU’s single market of 450 million consumers to key export sectors including textiles, gems and jewelry, and leather goods.
India is a market where we see improving momentum. Both businesses and consumers spent much of 2025 in a holding pattern – cautious amid tariff uncertainty, still adjusting after the post-COVID reopening normalization, and lacking near-term catalysts to drive conviction. With the passage of time, that caution is giving way to confidence, and we expect activity to pick up meaningfully from here.
Early evidence is already visible, e.g. in the auto sector, where demand has revived sharply following GST rate rationalization that improved vehicle affordability across mass-market segments. These are the kinds of dynamics that tend to become self-reinforcing: improving demand leads to better corporate earnings, which drives hiring, which supports consumption, and so on. We believe India is in the early stages of this virtuous cycle.
As we wrote in our August 2025 commentary, adversity is what often forces economies and companies to sharpen their competitiveness. India’s nearly two years of underperformance relative to regional peers, the absence of an AI-enabler story, and the overhang of US tariffs, collectively forced policymakers, corporates, and institutions to go back to basics and think hard about India’s inherent competitive advantages. The US reciprocal tariffs, paradoxically, may prove to be one of the best things to happen to India from a medium-term perspective. What looked like near-term headwinds became a medium-term opportunity when officials and firms raised their game. The tariffs were that inflection point – the catalyst that accelerated trade diversification, reform urgency, and corporate discipline.
The results are now becoming tangible. The India-EU free trade agreement and the emerging India-US trade framework are significant structural developments. While the details of the US framework are still being finalized, the broad architecture is taking shape: India opens access to goods not manufactured domestically at lower tariffs, while in return gaining substantially larger export markets in both the US and EU for its manufacturing base. This is a meaningful boost to the China+1 story, which had been largely on hold amid trade uncertainty.
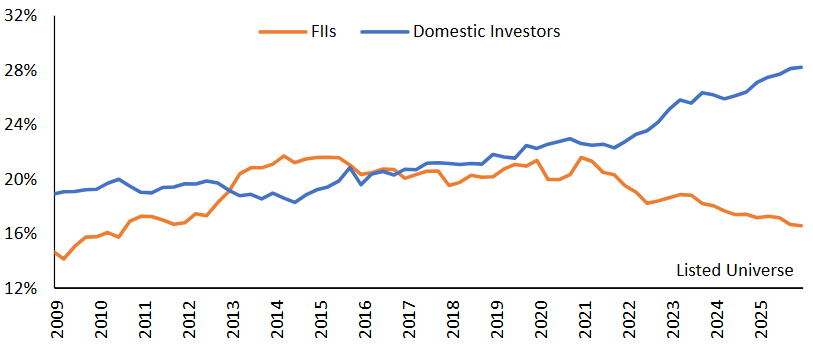
For foreign investors, these agreements are arguably most important in removing the overhang of currency uncertainty. With a clearer trade architecture in place, the risk premium on the rupee should begin to normalize. Foreign institutional ownership in Indian equities remains near multi-year lows, but we expect that is about to shift.
Latest Earnings and Union Budget
On the earnings front, the Q3 FY26 reporting season has been noisy, but we would not read too much into the headline numbers as several one-off adjustments may be distorting the picture. The GST rate rationalization from September created accounting discontinuities for certain consumer-facing businesses, depressing reported revenue growth even where underlying volumes remain healthy. Additionally, the implementation of India’s new labor code has required companies to increase provisions for pension and other employee-related liabilities, creating an earnings drag that is structural in nature. Corporate commentary during this period was also colored by the absence of a trade deal and the weight of 50% US tariffs – a backdrop that has since improved materially. With the US trade framework now taking shape and the EU deal in place, we expect management sentiment and forward guidance to improve at the margin in coming quarters.
As for the Union Budget, the market had built expectations around potential tax relief for FPIs or reductions in securities transaction tax. None of this materialized, but we would caution against over-interpreting the budget in either direction. Over the past four to five years, India’s most significant policy actions (e.g. GST rationalization, labor reforms, RBI rate cuts) have been enacted outside of the budget cycle. The budget is increasingly a statement of fiscal accounts rather than a vehicle for transformative policy, and investors would be well served to focus on the broader reform trajectory rather than any single fiscal event.
That said, the budget does reflect continuity with the themes laid out in the Economic Survey, and several elements are worth highlighting. Fiscal consolidation remains on track, with the deficit target narrowing by 10 basis points to 4.3% of GDP while the debt-to-GDP ratio continues its downward trajectory.8 On the tax front, the government is moving toward a more trust-based system (converting penalties to fines and decriminalizing certain provisions), which should encourage formalization among smaller enterprises and improve compliance over time. Input costs are being addressed through selective reductions in customs duties, while MSMEs benefit from expanded credit guarantees and a new champion fund. There is also a notable focus on what policymakers are calling the “orange economy” – skilling initiatives in allied health, tourism, and creative industries that are designed to generate employment in sectors less susceptible to AI displacement. Overall, we think the budget is aligned with India’s longer-term structural priorities: strategic resilience, manufacturing competitiveness, and broad-based job creation.
AI infrastructure plays have been sucking all the oxygen out of the room. In the near term, we expect further parabolic moves as the market fixates on supply shortages, but our view is that many of these stocks will peak within six months as a significant amount of optimism is already priced in. Year-over-year AI capex and data center spending growth is already decelerating off a high base. With this year’s number already at US$650 billion, the rate of growth will naturally slow.9 The second leg of the AI story, which we find more compelling from a medium-term perspective, will come through consumer and internet companies leveraging AI to drive measurable productivity gains and margin expansion.
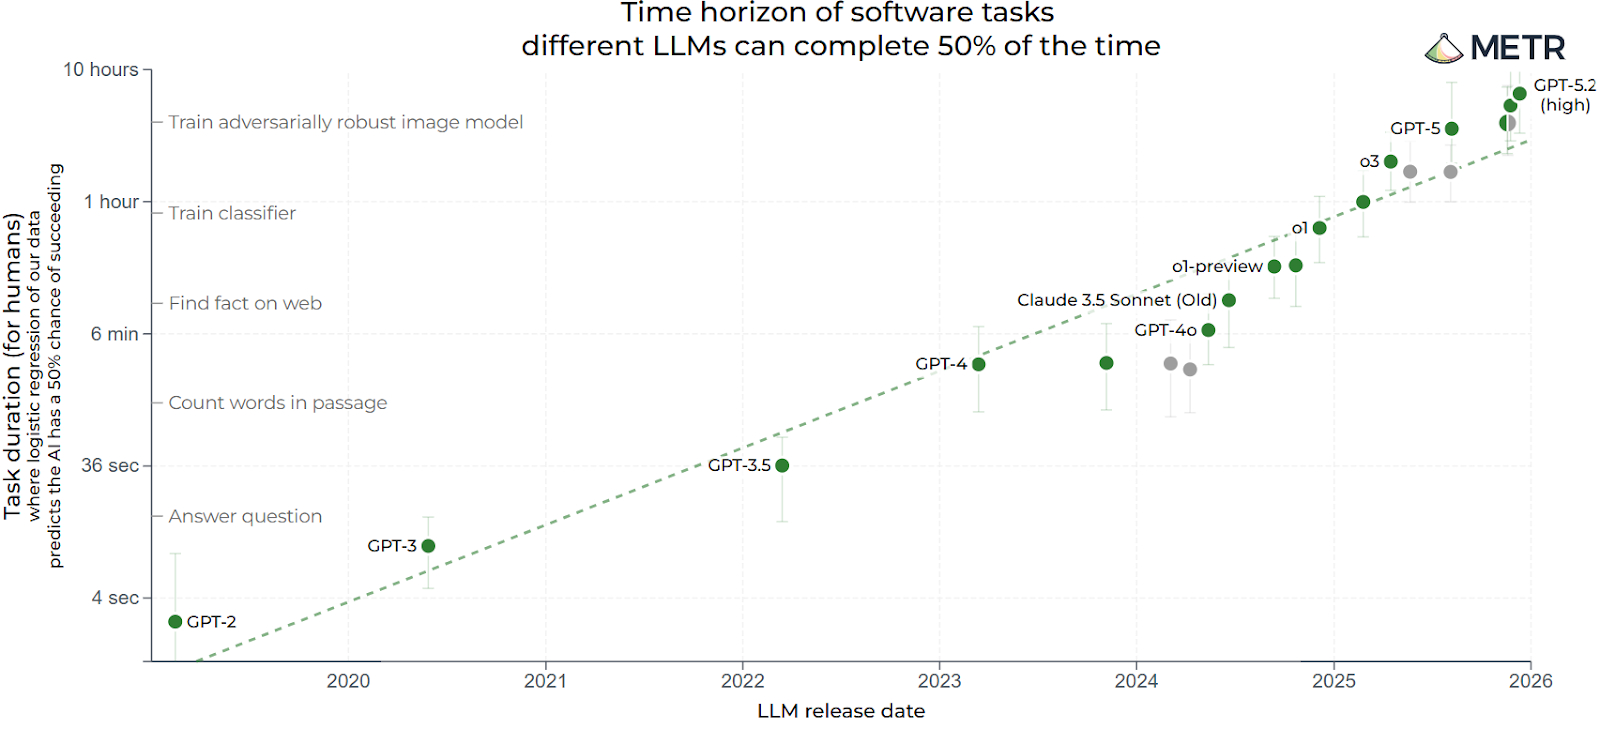
The following chart illustrates why we think the market is underestimating the efficiency upside of AI adopters. METR’s chart shows an almost exponential jump in capability: the best LLMs are moving from handling minutes-long coding tasks to completing hours-long tasks at a similar success rate – meaning AI agents can now take on much longer, end-to-end pieces of knowledge work. If that trajectory persists, it is precisely the adopters that stand to capture the operating leverage, despite the market’s current indiscriminate selling.
The current market dynamic reminds us of what played out during COVID. Back then, the stay-at-home basket rallied relentlessly until investors gained confidence in reopening and vaccines, while the reopening basket was being aggressively shorted. Once the economy began to reopen, the performance of these baskets reversed sharply. We see a similar pattern emerging in AI today: infrastructure plays are commanding all of the market’s attention, while AI adopters are being sold indiscriminately – irrespective of whether those businesses will actually face disruption.
In markets, there is always an investable basket. During periods like this, it’s important to know when to sell-on-rise where the market is becoming too exuberant, and when to buy-on-dips where extreme pessimism is already baked in. Today, AI infrastructure plays carry a lot of bullishness while AI adopters carry a lot of pessimism.
This rotation has direct implications for India. Until now, the market has penalized India for lacking AI-enabler stories (i.e. the chipmakers and hyperscalers that drove returns in the US and North Asia). But as the focus shifts from who is building AI infrastructure to who is deploying it most effectively, India is well positioned. Indian companies in IT services, consumer platforms, and financial services have been investing heavily to embed AI across their operations. This transition plays directly to India’s strengths: a deep pool of engineering talent, a digitally advanced consumer base, and management teams that are operationally nimble. As the market begins to reward adoption over enablement, India stands to benefit.
Having laid out the macro case for why we’re constructive on India (from the AI adoption pivot to the China+1 manufacturing opportunity, to the trade agreements now unlocking new export corridors), the natural follow-up is: which companies are actually turning these tailwinds into earnings? Below, we profile three of our portfolio holdings where these themes are showing up not as talking points, but as measurable drivers of productivity, market access, and revenue growth.
| Company | Investment Thesis |
|---|---|
| MakeMyTrip | MakeMyTrip is India’s dominant online travel platform, commanding over 60% market share in a sector with significant runway as travel penetration deepens beyond tier-one cities.10 The company is leveraging this leadership position to pioneer AI-driven engagement. India’s online travel market has a language problem: hundreds of millions of potential travelers (particularly in tier 2 and tier 3 cities) are uncomfortable booking in English, and traditional search-and-filter interfaces feel unintuitive for first-time users planning complex trips. MakeMyTrip’s response was Myra, a GenAI-powered trip planning assistant launched in August 2025 that supports voice and text in English and Hindi, with more Indian languages planned. Myra has scaled to over 25,000 conversations daily, and the usage pattern is telling: 35% of travelers begin engaging up to 90 days before their trip, using it for destination discovery, visa queries, and itinerary planning.11 One in four users returns multiple times before booking. This transforms MakeMyTrip from a transactional platform into a travel companion. The company also deployed a GenAI pre-sales chatbot that management says drives meaningfully higher conversion than traditional agent-led assistance. CEO Rajesh Magow has acknowledged the competitive threat from agentic AI in travel but argues that success depends on customizing LLMs with proprietary data and, with 83 million lifetime transacting users, we think MakeMyTrip’s data moat is defensible.12 |
| Apollo Hospitals | Apollo Hospitals has arguably been the most ambitious AI adopter in Asian healthcare. India’s healthcare workforce is stretched thin. Nurse attrition at Apollo runs at 25% while clinicians spend hours on documentation that could be spent with patients.13 Apollo has responded by dedicating 3.5% of its digital budget specifically to AI tools that automate medical documentation and scheduling, with the stated aim of freeing up 2-3 hours per day per healthcare professional.14 The ambition goes beyond cost savings. In partnership with Microsoft, Apollo is co-developing four healthcare copilots tailored for clinicians, patients, nurses, and hospital operations, alongside an AI roadmap for disease progression modeling, genomics, and multi-modal diagnostics. A new Centre for Digital Health and Precision Medicine, launched with the University of Leicester, focuses on AI-integrated diagnostics and genomics-led precision medicine. The digital platform Apollo 24/7 added 3 million new users in Q2 FY26, while reducing losses by 30% y/y.15 With over 10,000 beds, 6,600 pharmacies, and 2,200 diagnostic centers, Apollo’s scale gives its AI investments a multiplier effect that we think smaller chains cannot replicate.16 |
| Sansera Engineering | We first engaged with Sansera five years ago in the lead up to the company’s IPO. Founded in 1981 as a precision forging and machining shop serving India’s automotive OEMs, the company spent three decades mastering complex, safety-critical components for customers like Honda, Yamaha, and Maruti Suzuki. That legacy of engineering precision is now being redeployed into far higher-value end markets. Over the past five years, Sansera has built an Aerospace, Defence & Semiconductor (ADS) division that is becoming a material earnings driver. In June 2025, the company signed its first direct Airbus contract – a INR 1.6 billion (USD 18.8 million) agreement making it the first Indian supplier selected for Airbus’s airborne medical transport modules.17 It now supplies precision components across both Airbus and Boeing platforms. ADS revenue reached INR 1.2 billion in FY25, with management guiding to a near-doubling in FY26.18 The macro tailwinds for Sansera are exciting. With ~20% of revenue from Europe and 63% of its order book from overseas, Sansera benefits directly from the India-EU free trade agreement.19 Additionally, a January 2026 JV with Japan’s Nichidai Corporation extends this positioning further. |
We believe we are still early in this cycle. Capital remains concentrated in the regions and sectors that led the last leg of the market, and the rotation toward adopters and underowned markets like India is only just starting to come into focus. Specifically on AI, as more companies move from pilot to production and begin reporting quantifiable productivity gains, margin improvements, and revenue uplift in their quarterly results, the market will be forced to take notice. The re-rating of AI adopters won’t happen in a single quarter – it will build incrementally, earnings call by earnings call, as the gap between what is priced in (very little) and what is being delivered (increasingly, quite a lot) becomes impossible to ignore. This is where we want to be positioned.
For sophisticated investors only. For informational purposes only. The information presented in the material is not, and may not be relied on in any manner as legal, tax, investment, accounting or other advice or as an offer to sell or a solicitation of an offer to buy an interest in any investment product or any other entity sponsored or managed by Shikhara Investment Management. This material doesn’t constitute and should not be considered as any form of financial opinion or recommendation.
This material is prepared by Shikhara Investment Management LP (“Shikhara”). This material does not constitute an offer to sell or the solicitation of an offer to buy in any state of the United States or other U.S. or non-U.S. jurisdiction to any person to whom it is unlawful to make such offer or solicitation in such state or jurisdiction.
Investment involves risk. Past performance is not indicative of future performance. It cannot be guaranteed that the performance of the investment product will generate a return and there may be circumstances where no return is generated. Investors could lose all or a substantial portion of any investment made. Before making any investment decision, investors should read the Prospectus for details and the risk factors. Investors should ensure they fully understand the risks associated with the investment product and should also consider their own investment objective and risk tolerance level. Investors are advised to seek independent professional advice before making any investment.
Shikhara’s investment products are suitable only for sophisticated investors and require the financial ability and willingness to accept the high risks and lack of liquidity inherent in Shikhara’s investment products. Prospective investors must be prepared to bear such risks for an indefinite period of time. No assurance can be given that the investment objectives of any given investment product will be achieved or that investors will receive a return of their investment.
Certain of the information contained in this material are statements of future expectations and other forward-looking statements. Views, opinions and estimates may change without notice and are based on a number of assumptions which may or may not eventuate or prove to be accurate. Actual results, performance or events may differ materially from those in such statements.
Certain information contained in this material is compiled from third-party sources. Whereas Shikhara has, to the best of its endeavor, ensured that such, information is accurate, complete and up-to-date, and has taken care in accurately reproducing the information, Shikhara takes no responsibility for the accidental publication of incorrect information, nor for investment decisions taken based on this material. Neither Shikhara nor any of its affiliates makes any representation or warranty, express or implied, as to the accuracy or completeness of the information contained herein, and nothing contained herein should be relied upon as a promise or representation as to past or future performance of any investment product or any other entity.
The contents of this material are prepared and maintained by Shikhara and has not been reviewed by the Securities and Exchange Commission of the United States.
The Fund managed by Shikhara may or may not hold all of, or some of the securities mentioned in the article.
The Shikhara logo and name are trademarks of Shikhara Investment Management LP, registered in Hong Kong, the People’s Republic of China (PRC), Australia, the United Kingdom and the European Union and pending registration in the United States.
This website is published exclusively for the purpose of providing general information about the management services carried out by Shikhara Investment Management LP, Shikhara Capital (Hong Kong) Private Limited and its affiliates (collectively “Shikhara Investment Management” or “Shikhara”). The information presented on the website is not, and may not be relied on in any manner as legal, tax, investment, accounting, or other advice or as an offer to sell or a solicitation of an offer to buy an interest in any investment product or any other entity sponsored or managed by Shikhara Investment Management. This website doesn’t constitute and should not be considered as any form of financial opinion or recommendation.
Shikhara Investment Management LP is currently an Exempt Reporting Adviser that is exempt from registration as an investment adviser with the U.S. Securities and Exchange Commission and Shikhara Capital (Hong Kong) Private Limited has been approved by the Hong Kong Securities and Futures Commission. This website does not constitute an offer to sell or the solicitation of an offer to buy in any state of the United States or other U.S. or non-U.S. jurisdiction to any person to whom it is unlawful to make such offer or solicitation in such state or jurisdiction.
Investment involves risk. Past performance is not indicative of future performance. It cannot be guaranteed that the performance of the investment product will generate a return and there may be circumstances where no return is generated. Investors could lose all or a substantial portion of any investment made. Before making any investment decision, investors should read the Prospectus for details and the risk factors. Investors should ensure they fully understand the risks associated with the investment product and should also consider their own investment objective and risk tolerance level. Investors are advised to seek independent professional advice before making any investment.
Shikhara’s investment products are suitable only for sophisticated investors and require the financial ability and willingness to accept the high risks and lack of liquidity inherent in Shikhara’s investment products. Prospective investors must be prepared to bear such risks for an indefinite period of time. No assurance can be given that the investment objectives of any given investment product will be achieved or that investors will receive a return of their investment.
Certain of the information contained in this website are statements of future expectations and other forward-looking statements. Views, opinions, and estimates may change without notice and are based on a number of assumptions which may or may not eventuate or prove to be accurate. Actual results, performance, or events may differ materially from those in such statements.
Certain information contained in this website is compiled from third-party sources. Whereas Shikhara Investment Management has, to the best of its endeavor, ensured that such information is accurate, complete, and up-to-date, and has taken care in accurately reproducing the information, Shikhara Investment Management takes no responsibility for the accidental publication of incorrect information, nor for investment decisions taken based on this website. Neither Shikhara Investment Management nor any of its affiliates makes any representation or warranty, express or implied, as to the accuracy or completeness of the information contained herein, and nothing contained herein should be relied upon as a promise or representation as to past or future performance of any investment product or any other entity.
The contents of this website are prepared and maintained by Shikhara Investment Management and has not been reviewed by the Securities and Exchange Commission of the United States or the Securities and Futures Commission of Hong Kong.
The Shikhara logo and name are trademarks of Shikhara Investment Management LP, registered in Hong Kong, the People’s Republic of China (PRC), Australia, the United Kingdom, the European Union, and the United States.