
January reflected a familiar pattern: markets can be noisy even when fundamentals are quietly improving. We think AI infrastructure has dominated attention and valuations, while many AI adopters are being treated as collateral damage in risk-off moments. In environments like this, the most critical skill is knowing which part of the market to sell-on-rise and which to buy-on-dips. In this month’s commentary, we lay out why we expect the next leg of the cycle to be driven less by capex headlines and more by operating leverage, i.e., companies that can translate AI into measurable gains in productivity, engagement, and margins. We also highlight early proof points from across our portfolio where adoption is moving from pilots to the P&L.
The MSCI All Country Asia Ex-Japan Index rose 8.21% (in USD terms1) over the month of January. Relative to the rest of the region, South Korea and Taiwan were the top performers, while India and Indonesia were the laggards. Sector-wise, IT and Industrials led performance, while Energy and Consumer Staples were the worst performers.
MSCI China rose 4.69% in January, supported by improving economic data and a policy shift in the property sector. China’s full-year 2025 GDP came in at 5.0%, meeting Beijing’s target, though Q4 growth slowed to 4.5% y/y, weighed down by soft domestic demand and a prolonged property slump.2 December CPI rose 0.8% y/y, the highest since February 2023, while the official manufacturing Purchasing Managers’ Index (PMI) returned to expansion at 50.1 after eight consecutive months of contraction.3 Notably, regulators formally ended the “three red lines” policy this month (the stringent leverage caps on property developers introduced in 2020 that are widely viewed as having triggered the sector’s prolonged crisis).
Indian equities declined 5.09% in January, as persistent foreign investor selling and cautious sentiment ahead of the Union Budget weighed on the market. Foreign portfolio investors (FPIs) sold approximately USD 4 billion of equities during the month, extending a trend that saw almost USD 19 billion in net outflows in 2025.4 On the macro front, India’s manufacturing PMI edged up to 55.4 in January (vs 55.0 in December), indicating continued expansion, though business confidence fell to its lowest level since mid-2022.5 A landmark development was the conclusion of the India-EU Free Trade Agreement on January 27, after nearly two decades of negotiations. Described as the “mother of all deals,” the agreement creates the world’s largest free trade zone encompassing two billion people and approximately 25% of global GDP, with tariffs to be eliminated/reduced on ~97% of bilateral trade.6
Korean equities surged 28.11% in January, with KOSPI breaking through the 5,000 level for the first time to close the month at 5,224. The rally was led by semiconductor heavyweights, as Samsung Electronics and SK Hynix both hit record highs on the back of soaring AI-driven demand for high-bandwidth memory (HBM). Export data reinforced the momentum: January exports surged 34% y/y to USD 65.9 billion, a record for the month, with semiconductor exports more than doubling to USD 20.5 billion.7 Despite the strong equity performance, the underlying economy told a more nuanced story. Full-year 2025 GDP grew just 1.0% (the slowest since 2020) and Q4 GDP contracted 0.3% q/q, driven by a 3.9% plunge in construction investment and weakening domestic demand.8
Taiwanese equities gained 11.16%, with the TAIEX surging past the 30,000 level to reach record highs. TSMC was the primary driver, with its shares climbing after reporting a 35% increase in Q4 profit and guiding for capex of USD 52-56 billion in 2026, signaling confidence in the sustained AI demand cycle.9 The broader tech sector also benefited from AI tailwinds emanating from CES 2026, while memory stocks saw strong gains on the back of continued HBM demand.
ASEAN markets delivered mixed returns in January. Malaysia led the region (+7.05%), followed by Thailand (+6.58%), the Philippines (+5.02%), and Singapore (+4.09%). For Malaysia, the market was lifted by the ringgit’s surge to its strongest level since 2018, while Thailand saw a rally in the lead-up to its general election in early February. Indonesia, however, was the notable laggard, declining 4.75% amid a market crisis triggered by MSCI’s warning of a potential downgrade from “emerging” to “frontier” market status. MSCI cited concerns over opacity in shareholding structures, low free-float levels, and possible coordinated trading behavior that undermines proper price formation. Indonesian regulators have pledged to double the minimum free-float requirement to 15% and undertake broader market governance reforms. MSCI has given Indonesia until May 2026 to demonstrate progress.
As we have been articulating since March last year, we believe the global economy is entering a new investment cycle. The recent market volatility (driven by the unwinding of strong 2025 winners and JGB spikes) is, in our view, more technical in nature rather than reflective of fundamental deterioration. Confidence returned in January, and the broader macro backdrop remains constructive.
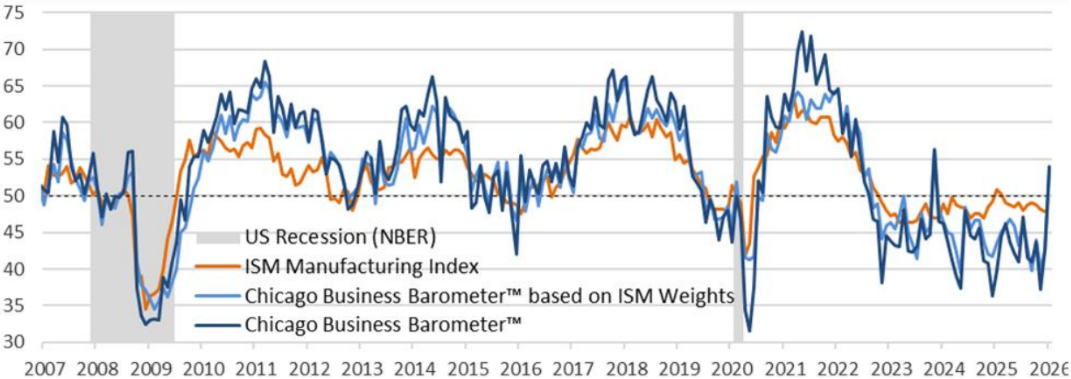
In general, no bad news is good news – businesses are focused on improving productivity quarter on quarter, and the new US Fed Chair nominee’s messaging around balance sheet management alongside rate cuts does not materially alter this picture. The US Q4 GDP forecast is coming in strong, underpinned by resilient consumer spending and exports. Consistent with this firmer tone, the latest Chicago Business Barometer jumped 11.3 points to 54.0 in January, finally back in expansionary territory for the first time since November 2023.10 While it remains a single regional data point, the breadth of the rebound supports the view that activity is improving despite the recent noise.
Earnings results have also been robust. With roughly half the S&P 500 having reported, EPS growth is tracking higher than the start of the earnings season, and the beat rate remains above historical norms. Looking into 2026, guidance has been encouraging (over half of companies providing 2026 outlooks are guiding above consensus) while AI remains a dominant theme, with hyperscaler capex expectations revised higher even as the growth rate likely slows off a high base.
The key question is when and whether job losses begin to weigh on demand. We are already seeing pockets of pressure in select consumer names, though this is being masked by market share gains at dominant platforms like Walmart and Amazon.
Many investors have asked us about the recent market volatility, especially the sharp moves in Korea over the first week of February. Our view is that some pullback is healthy after such a pronounced rally. What we’re observing now is indiscriminate selling across both AI winners and laggards, as the market searches for direction. The AI enablers trade has worked well for an extended period, and investors are naturally anxious about when the growth slowdown will arrive. At the same time, the AI adopters have yet to fully quantify the productivity gains from their AI investments. We have seen early signals from companies like Tencent and, more recently, Meta’s latest earnings, but our view is that as more adopters begin to articulate these benefits, the market will start to appreciate the operating leverage embedded in these businesses. More on this in our AI section below.
Another potential catalyst for this rotation could be a higher-than-expected inflation print that shifts expectations toward the Fed holding rates rather than cutting. In that scenario, we would expect capital to come out from the AI enablers and, given the absence of any immediate recession risk and a still-resilient economy, that pool of capital will flow into the AI adopters, many of which have been punished over the past 18 months and now look attractive on a risk-reward basis.
Korea & Taiwan: Earnings Visibility Leads the Way
Within Asia, the earnings picture has been particularly encouraging in Korea and Taiwan. Korean memory and industrial companies delivered a strong set of numbers with robust forward visibility over the next 9-12 months. Their healthy order books and positive outlooks explain why the market has been such a standout performer year-to-date. In Taiwan, TSMC continues to see strong demand momentum, with a positive outlook for MediaTek on the back of ASICs driving a meaningful revenue boost into H2 2026 and 2027. Importantly, TSMC has been disciplined about capacity expansion, keeping realization increases to below 10% per year, whereas memory names have ramped capacity more aggressively and the price gains for their end products are also manyfold. This measured approach, in our view, lowers the risk of an AI supply bubble on the foundry side.
China: Policy Supportive, but Confidence Still Rebuilding
China remains somewhat lackluster. There are early signs of a pickup (e.g. Macau visitation data and Moutai sales) which offer some encouragement, but we’ve not yet seen evidence of a broad-based confidence recovery. The government’s recent supportive policy stance, including the removal of the “three red lines”, are constructive developments that should facilitate consolidation in the real estate sector. Stronger developers will now be more confident to acquire smaller peers with attractive land banks, while buyers who had been holding off due to concerns about developer viability may begin to re-enter the market. That said, confidence takes time to rebuild, and we expect this to be a gradual process rather than a sharp inflection. In this environment, we continue to focus our investments on Chinese companies that can compete effectively in global markets, allowing them to expand their total addressable market (TAM) beyond domestic constraints.
India: Recovery Building for a Pick-up in 2026
India is a market where we see improving momentum. Both businesses and consumers spent much of last year in a holding pattern – cautious amid tariff uncertainty and still adjusting after the post-COVID reopening normalization. With the passage of time, confidence is building, and we expect activity to pick up. Early evidence is already visible in the auto space, where demand is reviving following tax rationalization that improved vehicle affordability. As this recovery builds on itself, it should become self-reinforcing. Importantly, the narrative around AI is also shifting in India’s favor. Investors had been concerned about the lack of AI-enabler stories and the potential for disruption, but 2026 should see the focus pivot to AI adopters – and Indian companies have been investing heavily in the latter to position themselves on this front.
The India-EU free trade agreement and the emerging India-US trade framework are also significant developments. While the details are still being ironed out, the broad architecture involves India opening access to goods not manufactured domestically at lower tariffs, while in return gaining much larger export markets in the US and EU for its manufacturing base. This provides a meaningful boost to the China+1 story, which had been on hold until now. For foreign investors, these agreements are arguably most important in removing the overhang of currency uncertainty that had weighed on sentiment over the prior 3-6 months.
ASEAN: Differentiated Positioning in a Diverging Region
Within ASEAN, our positioning remains differentiated. We have no exposure to Indonesia, where we have been uncomfortable with the policy direction under the current coalition. In a world where AI disruption demands strong, decisive leadership, we are concerned that Indonesia risks following Thailand’s trajectory, where domestic companies have progressively lost competitiveness to Chinese entrants. The MSCI’s recent scrutiny around free float and transparency standards reinforces these governance concerns. Meanwhile, credit rating agencies like Moody’s have raised red flags about unpredictable policies and risks, such as a wider budget deficit or a less independent central bank. Instead, we would rather access Indonesia and broader ASEAN exposure through Singapore-domiciled platforms like Sea and Grab, which offer pan-regional reach with stronger governance and competitive moats.
Vietnam, by contrast, has been a standout, and very much in line with what we have been articulating. This is what the new competitive landscape demands – a strong, proactive government that implements policies conducive to attracting investment, while leveraging the country’s deep and growing talent pool. Vietnam is a frontier market that we have backed with conviction. While much of the market was chasing benchmark weights, we stayed away from Indonesia (an emerging market now facing the prospect of a downgrade) and instead allocated to Vietnam, where the growth story is real and accelerating.
AI infrastructure plays have been sucking all the oxygen out of the room. In the near term, we expect further parabolic moves as the market fixates on supply shortages, but our view is that many of these stocks will peak within six months as a significant amount of optimism is already priced in. Year-over-year AI capex and data center spending growth is already decelerating off a high base. With this year’s number already at US$650 billion, the rate of growth will naturally slow.11 The second leg of the AI story, which we find more compelling from a medium-term perspective, will come through consumer and internet companies leveraging AI to drive measurable productivity gains and margin expansion.
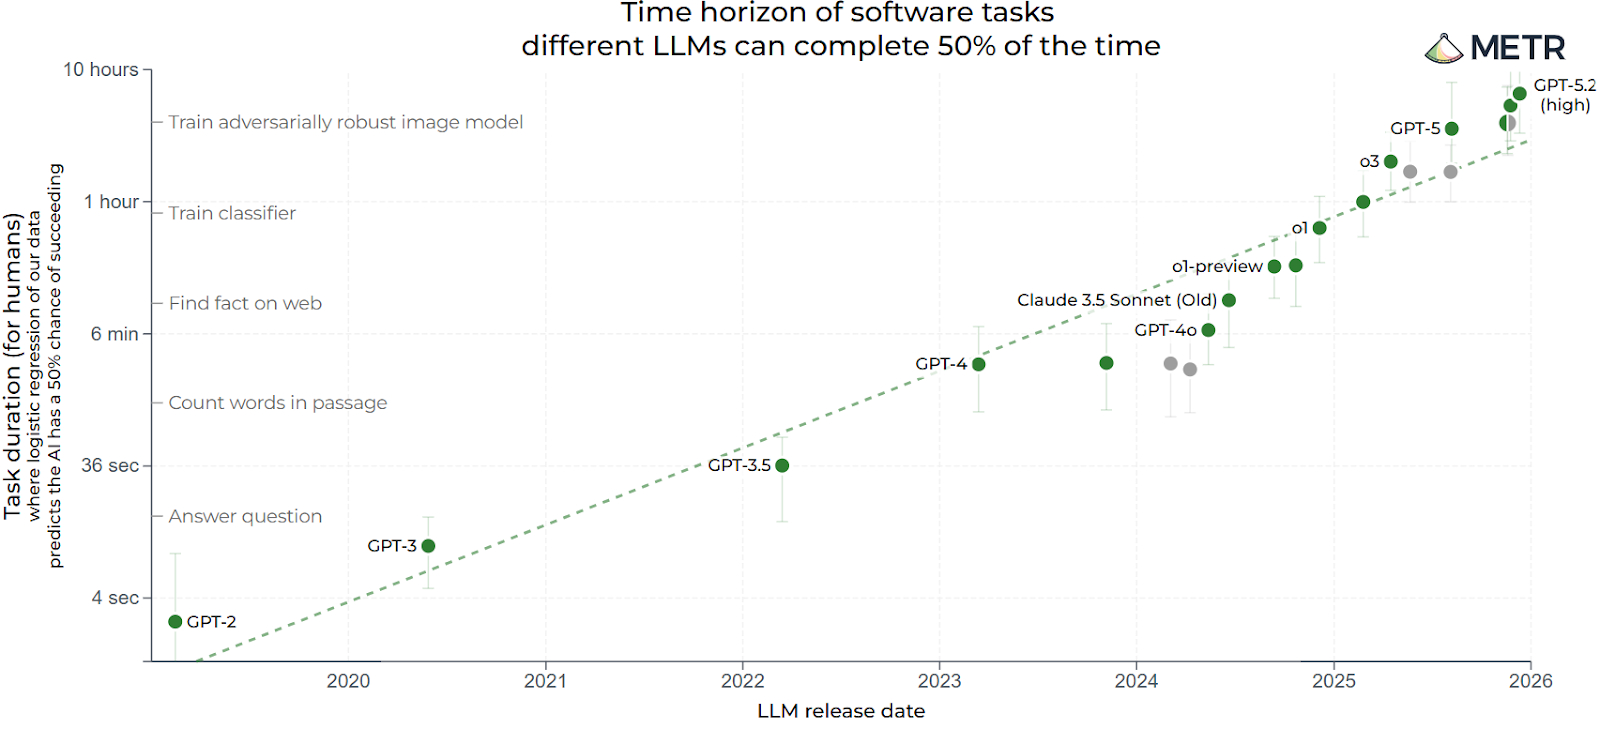
The following chart illustrates why we think the market is underestimating the efficiency upside of AI adopters. METR’s chart shows an almost exponential jump in capability: the best LLMs are moving from handling minutes-long coding tasks to completing hours-long tasks at a similar success rate – meaning AI agents can now take on much longer, end-to-end pieces of knowledge work. If that trajectory persists, it is precisely the adopters that stand to capture the operating leverage, despite the market’s current indiscriminate selling.
The current market dynamic reminds us of what played out during COVID. Back then, the stay-at-home basket rallied relentlessly until investors gained confidence in reopening and vaccines, while the reopening basket was being aggressively shorted. Once the economy began to reopen, the performance of these baskets reversed sharply. We see a similar pattern emerging in AI today: infrastructure plays are commanding all of the market’s attention, while AI adopters are being sold indiscriminately – irrespective of whether those businesses will actually face disruption.
Take gaming as an example. Several gaming companies have sold off on fears that AI tools will enable new entrants to develop disruptive titles. But it’s hard to believe that amateurs armed with AI could outcompete seasoned developers at Tencent or other global majors who have access to the same tools. The market is being too naïve in assuming that everything will be disrupted, that disruptors will emerge from every corner to unseat incumbents. The slow-moving incumbents will certainly lose share, but our view is that the smartest and most innovative companies will navigate disruption far better than the upstarts.
In markets, there is always an investable basket. During periods like this, it’s important to know when to sell-on-rise where the market is becoming too exuberant, and when to buy-on-dips where extreme pessimism is already baked in. Today, AI infrastructure plays carry a lot of bullishness while AI adopters carry a lot of pessimism.
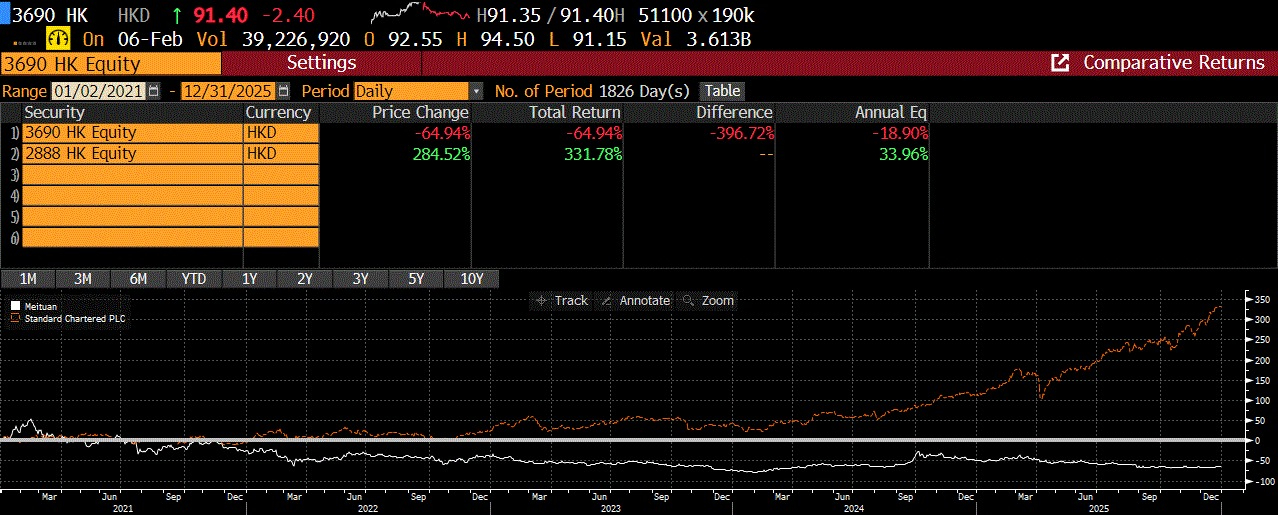
What gives us confidence over the long term is our experience with similar setups in the past. In 2021, after making 4x our money in Meituan, we slowly booked gains, selling a fraction of the holding on every 20-25% move higher.12 Meanwhile, those gains were redeployed into Standard Chartered Bank – an overlooked name trading at 0.3x P/B in 2021. Over the last four years, Standard Chartered has been up nearly 5x. The lesson is simple: focus on what is already priced in, assess the margin of safety, and sometimes it pays to move away from the herd. Of course, this rotation doesn’t happen all at once; it happens slowly and deliberately. But, as we have seen before, this herd is currently running off a cliff.
Having laid out the macro case for why we believe capital will rotate from AI infrastructure to AI adopters, the natural follow-up is: which companies are actually walking the talk? Below, we profile six of our portfolio holdings that are deploying AI not as a buzzword, but as a measurable driver of productivity, engagement, and revenue.
| Company | AI Use Case |
|---|---|
| Tencent | For years, digital advertising suffered from a fundamental inefficiency: advertisers spent heavily but struggled to target the right users at the right moment. Tencent has turned to AI to solve this problem, and the results are showing up directly in the P&L. Its new AIM+ platform automates targeting, bidding, placement, and ad creative – essentially letting AI run entire campaigns end-to-end. Marketing services revenue grew 21% y/y in Q3 2025, with management attributing the acceleration to AI-powered improvements in eCPMs (effective cost per thousand impressions) and advertiser ROI.13 Small and medium businesses, which previously lacked the sophistication to optimize digital campaigns, have been among the most enthusiastic adopters. But advertising is just one front. Tencent is also deploying AI across its entire ecosystem – from its Yuanbao AI assistant embedded in over 30 products to using its HunYuan foundation model to compress game development cycles and reduce content production costs. |
| Sea Limited | Running an e-commerce marketplace across Southeast Asia means onboarding millions of small sellers who often lack the resources to write compelling product listings, manage customer queries, or optimize their ad spend. Sea is using AI to do the heavy lifting. On Shopee, AI now auto-generates product listings and handles over 80% of customer service queries via chatbots, improving purchase conversion rates by 10% y/y.14 AI-driven search and recommendations contributed to a 70% surge in ad revenue and an 80bps improvement in ad take rates in Q3 2025.15 The flywheel extends beyond e-commerce: data from Shopee’s AI chatbots feeds into Monee’s real-time credit underwriting models, enabling the “all-can-apply” SPayLater approach that added five million first-time borrowers in Q3 alone.16 In logistics, AI-powered route optimization has cut delivery costs per order across Asia and Brazil. |
| Grab Holdings | Similarly, for Grab, two cost centers have always been stubbornly hard to optimize: onboarding merchants onto the platform and keeping drivers productive without inflating incentive payouts. Grab is using AI to attack both. Its merchant AI assistant has added more than 70,000 menu items to the platform without human intervention, while driving a 24% uplift in ad spend among merchants who engage with it.17,18, In ride-hailing, Ride Guide (an AI navigation and earnings optimization tool) is used by >250,000 drivers weekly, directly boosting productivity and income without raising subsidy costs.19 AI has also improved accessibility for the region’s diverse user base: speech recognition across Southeast Asian accents now reaches 90% accuracy, up from 46%, expanding the platform’s reach to visually impaired users.20 Internally, over 98% of Grab’s engineers use AI for coding, accelerating development cycles.21 |
| MakeMyTrip | India’s online travel market has a language problem. Hundreds of millions of potential travelers (particularly in tier 2 and tier 3 cities) are uncomfortable booking in English, and traditional search-and-filter interfaces feel unintuitive for first-time users planning complex trips. MakeMyTrip’s response was Myra, a GenAI-powered trip planning assistant launched in August 2025 that supports voice and text in English and Hindi, with more Indian languages planned. Myra has scaled to over 25,000 conversations daily, and the usage pattern is telling: 35% of travelers begin engaging up to 90 days before their trip, using it for destination discovery, visa queries, and itinerary planning.22 One in four users returns multiple times before booking. This transforms MakeMyTrip from a transactional platform into a travel companion. The company also deployed a GenAI pre-sales chatbot that management says drives meaningfully higher conversion than traditional agent-led assistance. CEO Rajesh Magow has acknowledged the competitive threat from agentic AI in travel but argues that success depends on customizing LLMs with proprietary data and, with 83 million lifetime transacting users, we think MakeMyTrip’s data moat is defensible.23 |
| IHH Healthcare | IHH Healthcare is a leading private hospital operator, running 80+ hospitals across Malaysia, Singapore, Turkey, India, and Greater China.24 In healthcare, one of the most time-critical bottlenecks is diagnostic accuracy – a missed finding on a chest X-ray or a pathology slide can mean the difference between early intervention and late-stage disease. IHH is deploying AI to address this directly. Its Turkish subsidiary Acibadem co-developed an AI-supported pathology application with Virasoft, with decision-support algorithms now live for breast, gastrointestinal, lung, and prostate cases. In Singapore, Parkway Radiology fully integrated Annalise.ai Enterprise CXR across all imaging clinics and four hospitals, supporting faster and more accurate chest X-ray reads. The company also launched MammoXpress – a mobile mammogram unit equipped with Lunit AI to bring screening directly into communities. In July 2025, IHH announced a multi-year partnership with Virtusa to explore GenAI and Agentic AI across the healthcare value chain, from patient care and hospital management to billing and regulatory compliance. |
| Apollo Hospitals | Apollo Hospitals has arguably been the most ambitious AI adopter in Asian healthcare. India’s healthcare workforce is stretched thin. Nurse attrition at Apollo runs at 25% while clinicians spend hours on documentation that could be spent with patients.25 Apollo has responded by dedicating 3.5% of its digital budget specifically to AI tools that automate medical documentation and scheduling, with the stated aim of freeing up 2-3 hours per day per healthcare professional.26 The ambition goes beyond cost savings. In partnership with Microsoft, Apollo is co-developing four healthcare copilots tailored for clinicians, patients, nurses, and hospital operations, alongside an AI roadmap for disease progression modeling, genomics, and multi-modal diagnostics. A new Centre for Digital Health and Precision Medicine, launched with the University of Leicester, focuses on AI-integrated diagnostics and genomics-led precision medicine. The digital platform Apollo 24/7 added 3 million new users in Q2 FY26, while reducing losses by 30% y/y.27 With over 10,000 beds, 6,600 pharmacies, and 2,200 diagnostic centers, Apollo’s scale gives its AI investments a multiplier effect that we think smaller chains cannot replicate.28 |
We are still in the early chapters of this story. As the examples above illustrate, the range of AI adoption across our portfolio varies widely across opportunities to solve consumer and business pain points. As more companies move from pilot to production and begin reporting quantifiable productivity gains, margin improvements, and revenue uplift in their quarterly results, the market will be forced to take notice. The re-rating of AI adopters won’t happen in a single quarter – it will build incrementally, earnings call by earnings call, as the gap between what is priced in (very little) and what is being delivered (increasingly, quite a lot) becomes impossible to ignore. This is where we want to be positioned.
For sophisticated investors only. For informational purposes only. The information presented in the material is not, and may not be relied on in any manner as legal, tax, investment, accounting or other advice or as an offer to sell or a solicitation of an offer to buy an interest in any investment product or any other entity sponsored or managed by Shikhara Investment Management. This material doesn’t constitute and should not be considered as any form of financial opinion or recommendation.
This material is prepared by Shikhara Investment Management LP (“Shikhara”). This material does not constitute an offer to sell or the solicitation of an offer to buy in any state of the United States or other U.S. or non-U.S. jurisdiction to any person to whom it is unlawful to make such offer or solicitation in such state or jurisdiction.
Investment involves risk. Past performance is not indicative of future performance. It cannot be guaranteed that the performance of the investment product will generate a return, and there may be circumstances where no return is generated. Investors could lose all or a substantial portion of any investment made. Before making any investment decision, investors should read the Private Placement Memorandum for details and the risk factors. Investors should ensure they fully understand the risks associated with the investment product and should also consider their own investment objective and risk tolerance level. Investors are advised to seek independent professional advice before making any investment.
Shikhara’s investment products are suitable only for sophisticated investors and require the financial ability and willingness to accept the high risks and lack of liquidity inherent in Shikhara’s investment products. Prospective investors must be prepared to bear such risks for an indefinite period of time. No assurance can be given that the investment objectives of any given investment product will be achieved or that investors will receive a return of their investment.
Certain of the information contained in this material are statements of future expectations and other forward-looking statements. Views, opinions, and estimates may change without notice and are based on a number of assumptions which may or may not eventuate or prove to be accurate. Actual results, performance or events may differ materially from those in such statements.
Certain information contained in this material is compiled from third-party sources. The information and any opinions contained in this document have been obtained from sources that Shikhara considers reliable, but Shikhara does not represent that such information and opinions are accurate or complete, and thus should not be relied upon as such. Furthermore, all opinions are current only as of the date of distribution and are subject to change without notice. Shikhara does not have any obligation to provide revised opinions in the event of changed circumstances. Whereas Shikhara has, to the best of its endeavor, ensured that such information is accurate, complete, and up-to-date, and has taken care in accurately reproducing the information, Shikhara takes no responsibility for the accidental publication of incorrect information, nor for investment decisions taken based on this material. Neither Shikhara nor any of its affiliates makes any representation or warranty, express or implied, as to the accuracy or completeness of the information contained herein, and nothing contained herein should be relied upon as a promise or representation as to past or future performance of any investment product or any other entity.
The MSCI AC Asia ex Japan Index captures large and mid-cap representation across Developed Markets (DM) countries (excluding Japan) and Emerging Markets (EM) countries in Asia. The index covers approximately 85% of the free float-adjusted market capitalization in each country. The MSCI China Index captures large and mid-cap representation across China A shares, H shares, B shares, Red chips, P chips, and foreign listings (e.g. ADRs). The index covers about 85% of the Chinese equity universe.
The contents of this material are prepared and maintained by Shikhara and have not been reviewed by the Securities and Exchange Commission of the United States.
The Shikhara logo and name are trademarks of Shikhara Investment Management LP, registered in Hong Kong, the People’s Republic of China (PRC), Australia, the United Kingdom and the European Union and pending registration in the United States.
This website is published exclusively for the purpose of providing general information about the management services carried out by Shikhara Investment Management LP, Shikhara Capital (Hong Kong) Private Limited and its affiliates (collectively “Shikhara Investment Management” or “Shikhara”). The information presented on the website is not, and may not be relied on in any manner as legal, tax, investment, accounting, or other advice or as an offer to sell or a solicitation of an offer to buy an interest in any investment product or any other entity sponsored or managed by Shikhara Investment Management. This website doesn’t constitute and should not be considered as any form of financial opinion or recommendation.
Shikhara Investment Management LP is currently an Exempt Reporting Adviser that is exempt from registration as an investment adviser with the U.S. Securities and Exchange Commission and Shikhara Capital (Hong Kong) Private Limited has been approved by the Hong Kong Securities and Futures Commission. This website does not constitute an offer to sell or the solicitation of an offer to buy in any state of the United States or other U.S. or non-U.S. jurisdiction to any person to whom it is unlawful to make such offer or solicitation in such state or jurisdiction.
Investment involves risk. Past performance is not indicative of future performance. It cannot be guaranteed that the performance of the investment product will generate a return and there may be circumstances where no return is generated. Investors could lose all or a substantial portion of any investment made. Before making any investment decision, investors should read the Prospectus for details and the risk factors. Investors should ensure they fully understand the risks associated with the investment product and should also consider their own investment objective and risk tolerance level. Investors are advised to seek independent professional advice before making any investment.
Shikhara’s investment products are suitable only for sophisticated investors and require the financial ability and willingness to accept the high risks and lack of liquidity inherent in Shikhara’s investment products. Prospective investors must be prepared to bear such risks for an indefinite period of time. No assurance can be given that the investment objectives of any given investment product will be achieved or that investors will receive a return of their investment.
Certain of the information contained in this website are statements of future expectations and other forward-looking statements. Views, opinions, and estimates may change without notice and are based on a number of assumptions which may or may not eventuate or prove to be accurate. Actual results, performance, or events may differ materially from those in such statements.
Certain information contained in this website is compiled from third-party sources. Whereas Shikhara Investment Management has, to the best of its endeavor, ensured that such information is accurate, complete, and up-to-date, and has taken care in accurately reproducing the information, Shikhara Investment Management takes no responsibility for the accidental publication of incorrect information, nor for investment decisions taken based on this website. Neither Shikhara Investment Management nor any of its affiliates makes any representation or warranty, express or implied, as to the accuracy or completeness of the information contained herein, and nothing contained herein should be relied upon as a promise or representation as to past or future performance of any investment product or any other entity.
The contents of this website are prepared and maintained by Shikhara Investment Management and has not been reviewed by the Securities and Exchange Commission of the United States or the Securities and Futures Commission of Hong Kong.
The Shikhara logo and name are trademarks of Shikhara Investment Management LP, registered in Hong Kong, the People’s Republic of China (PRC), Australia, the United Kingdom, the European Union, and the United States.