


Markets spent Q3 swinging between fear and relief. Beneath the noise, many of the overhangs weighing on Asia now look priced in, and we think it may not take much for markets to turn. We remain cautiously bullish, however, as sticky yields and an AI spending cycle that cannot compound indefinitely keep the risks firmly in view. In this edition, we explain why we are adding selectively to tech, how we are repositioning across China, Korea and India, and take a candid look back at past conviction calls alongside three new ideas. Enjoy!
| MSCI AC Asia ex Japan -0.23%1 |
The MSCI All Country Asia Ex-Japan Index was broadly flat over Q3 2026, declining 0.23%. July’s sharp unwind of the crowded AI trade was followed by a partial recovery in August, before rising global bond yields, the US Federal Reserve’s first rate increase since 2023, and Brent crude trading above USD 100 per barrel weighed on the region in September. Relative to the rest of the region, Singapore and Taiwan were the top performers for the quarter, while South Korea and India were the laggards. Sector-wise, Health Care and Financials led the performance over Q3, while Industrials and Information Technology were the worst performing sectors. |
| China +4.16% |
MSCI China ended the quarter higher, though the gains were made entirely in July. Chinese equities rallied strongly in July on a rotation into attractively valued internet and tech names and hopes of policy support around the Politburo meeting, before slipping in August as attention returned to the North Asian chip complex. The market fell further in September as rising global yields and soft domestic data weighed. August data showed retail sales up just 0.4% y/y and new home prices 3.0% lower y/y, while fixed-asset investment contracted 7.2% over the first eight months, even as industrial output grew 5.2%.2 The official manufacturing purchasing managers’ index (PMI) returned to expansion at 50.1 in September (vs 49.8 in August), and the non-manufacturing PMI rose to 50.2 (vs 49.0), suggesting a tentative stabilization, though both readings remain only marginally above the expansion threshold.3 |
| India -5.52% |
India was among the region’s laggards, as a steep September sell-off erased modest gains earlier in the quarter. The market edged lower despite Q1 FY27 GDP growth of 7.8% beating the Reserve Bank of India’s (RBI) projection and foreign investors briefly returning as net buyers in August.4 September brought a sharper decline, as firm crude prices, elevated global bond yields and sustained foreign outflows took hold, with foreign investors selling ~USD 3.75 billion of Indian equities, reversing two consecutive months of inflows and taking 2026 withdrawals to ~USD 27.8 billion.5 Retail inflation rose to 4.82% in August from 4.45% in July, led by food inflation of 5.95%, while wholesale inflation reached 9.92%.6 |
| South Korea -9.42% |
South Korea was the region’s weakest market in Q3, almost entirely a function of July’s collapse. The market plunged in July as the AI trade unwound, with circuit breakers and margin calls on leveraged retail positions triggering indiscriminate selling. Part of the losses were reversed in August and September as the large-cap memory names regained momentum. The export data told a very different story from share prices: September exports rose 83.5% y/y to a record USD 120.9 billion, with semiconductor shipments up 263% to USD 60.3 billion, the first month above the USD 60 billion level. Exports for January to September have already passed last year’s full-year record, keeping Korea on track for USD 1 trillion in 2026.7 The Bank of Korea delivered a second consecutive hike in late August, taking the base rate to 3.0%, and signaled growing concern over core inflation. |
| Taiwan +5.00% |
Taiwanese equities also saw a sharp correction in July but finished the quarter among the region’s leaders as AI-related demand continued to underpin the chip complex. August exports rose 41.0% y/y to a record USD 82.4 billion, with electronic components up 58.0% on demand for advanced chips and higher memory prices.8 Export orders surged 71.4% to USD 102.96 billion, surpassing USD 100 billion for the first time.9 Inflation has become the key macro watchpoint, with CPI at 2.04% in August, above the central bank’s 2% alert level for a fourth straight month. Even so, the Central Bank of the Republic of China (Taiwan) held its benchmark rate at 2% in September. |
| ASEAN Diverged |
ASEAN diverged sharply, with Singapore the region’s standout while most other markets gave back ground, especially in September. Singaporean equities were up 12.69%, supported by its defensive, bank-heavy composition, an upgraded 2026 growth forecast of 4.5-5.5%, and a fifth consecutive month of non-oil domestic export growth above 20% in August on AI-related demand.10 Indonesia (+2.90%) held on to part of its July rebound, despite a fall in September as foreign investors sold the large-cap banks. Bank Indonesia held its policy rate at 5.75% to support the rupiah, while FTSE Russell extended its restricted treatment of Indonesian securities until at least December, keeping the November MSCI review in focus. Malaysia (+1.96%) edged higher on Q2 GDP growth of 6.0%. The Philippines (-5.06%) and Thailand (-5.00%) lagged: the peso set successive record lows in early September even as inflation eased to 6.1% in August, while Thailand’s Q2 GDP growth of 1.9% was the slowest among the major ASEAN economies. |
Over the past month, we have moderately increased our exposure to tech, while maintaining a cautious stance on the sector. This reflects relative opportunity more than a change in our assessment of the risks (of which, many remain). The stocks have been through a meaningful correction and remain below their June and July highs, while earnings estimates have continued to roll forward, so valuations look considerably more attractive than they did at the peak. We have used the pullbacks to add to names we already like.
The more important change is visibility. Three to six months ago, we could not see a clear path to mass adoption, a revenue model, or a return on investment. That picture is now coming into focus, at least in enterprise software, where AI is being embedded into core products and a revenue model is emerging. After some time, the earnings data are also beginning to reflect this – Morgan Stanley’s mapping of its global coverage shows aggregate forward earnings for AI adopters is up ~70% over two years (largely from financials), although estimates for AI enablers are up more than 100% over the same period.11 In Asia, the shift is still early, with adopters only now showing signs of improving earnings momentum.
Capital returns are also putting a floor under the sector. In August, we flagged the wave of new tech paper coming to market as a persistent weight on multiples, and that risk has not gone away, but it is now also being met by buybacks. In September, NVIDIA’s board authorized a record USD 150 billion increase to its repurchase program, bringing total remaining capacity to USD 235 billion, while Samsung Electronics, SK Hynix and Micron are also all returning capital.
Our view on regulation has also evolved. We mentioned last month that no industry of this size stays unregulated for long, and two developments have since tempered that view. China has made clear that it will keep pushing ahead on AI, which turns the build-out into something closer to an arms race in which no one wants to be left behind. At the same time, the industry has moved toward self-regulation after the US administration brought leading players together, a proactive step that pre-empts a heavier-handed approach. Checks and balances are still needed, but the worst case now looks less likely in the near term.
The political landscape remains a variable we are watching. With the cost of living weighing on voters ahead of the midterms, a shift toward more populist policy is on many investors’ minds, and easing the inflation burden is likely to feature prominently. That could change the tone of the debate around AI, even if it is unlikely to halt the build-out.
None of this makes us outright bulls. We are neither early nor late in this cycle but somewhere in the middle, and ownership of the space remains high. The four largest US hyperscalers will have spent close to USD 1.5 trillion on capex across 2024-26, with annual spending set to roughly triple from around USD 250 billion in 2024 to over USD 750 billion this year.12 Spending at this pace cannot keep compounding indefinitely, and physical constraints may slow it before demand does.
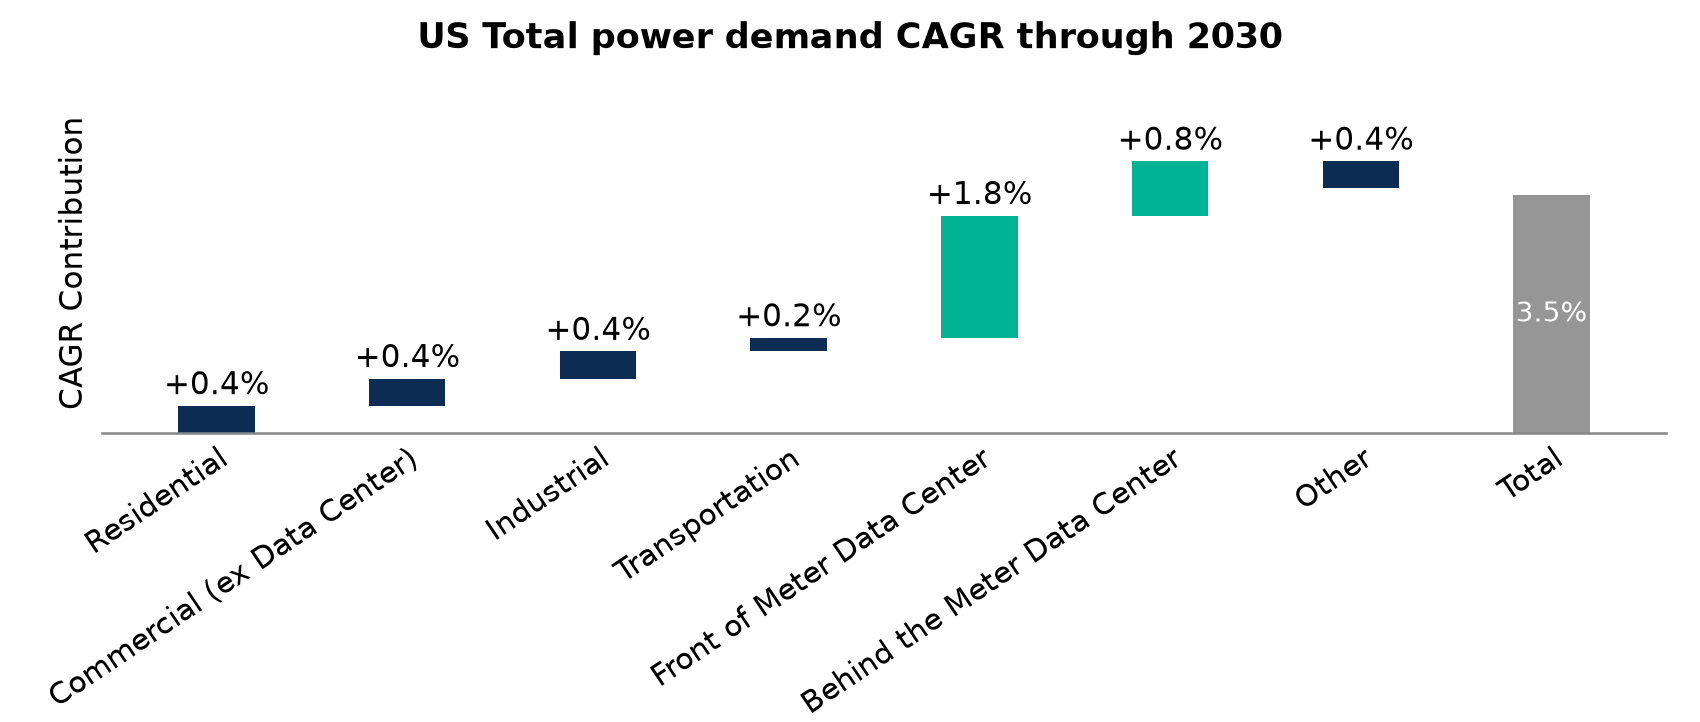
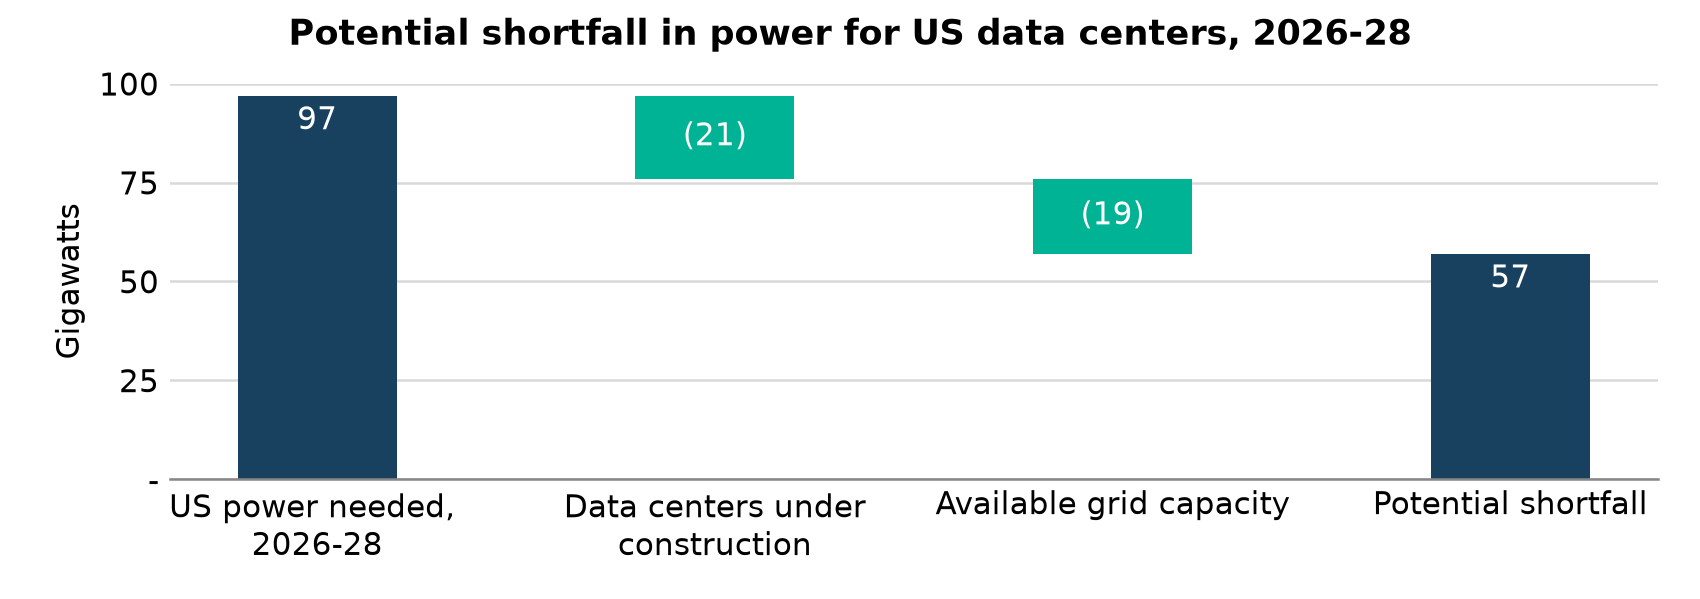
Every capex cycle ends, but this one has an unusual feature, in that the innovation it produces keeps creating new reasons to spend. Meta’s Muse and OpenAI’s Dot are recent examples, and they are likely to keep spending elevated in the near term. In time, we expect growth to shift more meaningfully from AI enablers to adopters, perhaps around 2028, though markets will move well before then.
The clean energy boom of 2021-22 offers a useful lesson here. The energy transition was, and remains, a genuine structural story, yet many investors who bought into it as a theme at the height of the enthusiasm lost a great deal of money as rising rates and stretched valuations caught up with it. Being right about a theme is not the same as profiting from it, and as active managers, we can ride the AI wave, reducing exposure when implied growth expectations become unreasonable, while scouting for structural growth opportunities in uncorrelated sectors.
The macro backdrop was the main overhang in September. Bond yields have moved higher as the US economy runs hot, with nominal GDP growing at an annualized 8.5% in the second quarter, and higher oil prices have compounded the pressure. If yields remain sticky, the pain will flow through to smaller businesses and weaker balance sheets, and we would expect some of the weaker dominoes to fall. Credit spreads are already widening in the weaker parts of the market, and refinancing will become harder for highly indebted companies and economies.
It is still early, however, and earnings growth remains strong. We think widespread defaults are unlikely, as governments have repeatedly shown they will step in, and for the strongest companies, the last ones standing, any downturn should prove temporary. Policy also offers a backstop. As we noted last month, the Fed’s balance sheet matters more than its rhetoric, and if yields rise too far, we would expect the response to move beyond the verbal reassurances offered so far.
Oil remains the other key overhang, as the stalemate in the Middle East has lasted far longer than anyone envisioned. The world has so far avoided the worst of the pain by drawing down inventories, but that buffer is wearing thin heading into winter and, if significant volumes of oil cannot move out of the region soon and idled refineries cannot restart, we expect companies will start cautioning about product shortages. Our sense is that Iran may be content to hold out until after the US midterms rather than hand the administration a victory beforehand.
The pressure, however, is increasingly building on Iran. Structurally, the world’s fossil fuel intensity continues to fall as the shift to renewables gathers pace. More immediately, Gulf producers have been able to reroute a growing share of their exports around the Strait of Hormuz, with crude exports from the region excluding Iran returning to pre-war levels in September and around 40% now bypassing the strait by pipeline.13 In early October, the US also eased sanctions on Russian diesel after Moscow agreed to supply 300,000 tons immediately and up to several million more in the following months, further weakening Iran’s leverage.14 Our hope is that a resolution can be found after the midterms.
Where we take a less conventional view is in how little it may take for equity markets to turn. Gains this year have been narrow and driven largely by tech, while much of the rest of the market has lagged and sentiment toward it remains subdued. Bond investors are similarly cautious, with many underweight bonds and favoring shorter maturities over long duration.
That leaves room for a potential reversal. Recent payroll data have softened, easing pressure on the Fed to keep raising rates, and conciliatory statements from Iran suggest the worst outcomes in the Middle East may be behind us, even with inventories low heading into winter. If these concerns ease, bond buyers could return and push yields back below 5%, and with oil easing, equities could rally strongly from here.
In other words, the market does not need good news so much as the resolution of one or two of its key overhangs, and with earnings and nominal growth still strong, the bias from there would be firmly to the upside. In the meantime, certain sectors like industrials and materials have sold off over the past two months, and we are looking for opportunities to add where the long-term case remains intact.
We have used the past month to reposition the portfolio, and the largest change has been in China, where we have reduced our exposure. The concerns over consumption and the strength of the underlying economy that we set out last month have deepened. Property remains at the heart of it: new housing starts are down 78% from their 2021 peak, back to 2003 levels.15 While the correction may already be overdone, a durable bottom likely requires large-scale, unconventional support that policymakers have been reluctant to deploy while AI-led exports remain strong.
There are, however, idiosyncratic areas where we see compelling opportunities in China, regardless of the macro backdrop. Health care is one of the cleanest areas of AI adoption, as companies use technology to improve efficiency, and this month we added Wuxi Biologics, a contract development and manufacturing business that fits our broader search for non-tech beneficiaries of AI with strong momentum.
We have also reduced our exposure to Singapore’s consumer platforms, Grab and Sea Limited. We had expected the most competitive platforms to adopt AI quickly and emerge stronger, but adoption has been slower than we anticipated, and capital allocation has become the dividing line between companies that will compound and those that will fall behind. Grab’s acquisition of a small loans business has, in our view, proven too large to digest, and we would rather wait for evidence of execution than hold on in hope.
We have redeployed part of that capital into Korea and Taiwan, adding to certain tech names. Samsung Electro-Mechanics is one example, where AI demand has created shortages in the substrates it supplies, and the capital return programs at Samsung Electronics and SK Hynix provide further support. Korean exporters have seen near-term earnings cuts as the Korean won appreciated considerably over the past quarter, but we expect the market to look through the currency to the underlying demand momentum, which remains healthy.
Elsewhere, India is where our conviction is quietly growing. The economy has delivered two quarters of strong growth with healthy business creation, and the trade deals India has signed reinforce its position as the leading China+1 destination. But India has nonetheless been unloved this year, with higher oil prices and the broader macro backdrop weighing on sentiment. What we think the market underappreciates is how much less sensitive India has become to oil in recent years. Oil consumption relative to GDP has halved over the past decade, helped by solar-powered irrigation, expanding metro networks, greater reliance on renewables by industry, and a growing shift to electric vehicles, while crude imports have fallen from a peak of 8.6% of GDP in 2013 to around 3% last year.16 Should tensions around the Middle East ease, lower oil prices would be a strong tailwind for India.
September was a flat to down month for most markets, and markets have pulled back further in recent days. We see this as an opportunity rather than a warning: concerns over midterm uncertainty and a slightly slower ramp in AI revenues are now largely in the price, while on-the-ground demand momentum remains strong and buybacks continue to provide support. The pullback has therefore improved the risk/reward.
As bond yields come down and companies report a good set of numbers, we would expect performance to come back, and all eyes will be on the upcoming earnings season, from tech results to India and Korea. With valuations reset and positioning light, the hurdle for a positive surprise is lower than it has been for some time.
We would describe ourselves as cautiously bullish, which for us means having thought through what could go wrong and preparing for multiple scenarios, drawing on what we have learned across geographies and sectors. We are not against tech, nor are we bullish on China. What we hold is a portfolio we believe is resilient, balancing a deliberate exposure to the AI build-out with idiosyncratic stories in India and health care that do not depend on it, and positioned to look through near-term dislocations rather than be driven by them.
Each quarter, we highlight a select number of companies that showcase exceptional growth potential. This quarter, we also take stock more broadly: we look back at two investments where our thesis has played out, two where it has taken longer than we expected, and introduce three new conviction calls that we added to the portfolio during Q3.
| Stock | Investment Rationale |
|---|---|
| Sansera Engineering | Sansera is an Indian precision-engineering manufacturer of critical components, with a long track record of supplying the global auto industry. Our thesis was that the same precision capabilities could be successfully redeployed into longer-cycle, higher-value end markets, and that India’s emergence as a manufacturing alternative to China would accelerate that shift. Both have played out. As semiconductor equipment makers and aerospace and defense companies build supply chains in India, Sansera has moved from being valued as a cyclical auto supplier to being seen as a strategic industrial partner. It is a good example of what we look for in India: a management team that has proven it can scale beyond its original market. |
| MediaTek | MediaTek is one of the world’s largest fabless chip designers, best known for the processors inside a large share of the world’s smartphones. We have held the stock for more than two years because we believed hyperscalers would increasingly design their own AI chips to reduce their reliance on merchant GPUs, and that a design partner with MediaTek’s scale and engineering depth would be a natural beneficiary. That shift is now under way, and the market has repriced MediaTek from a smartphone-centric business into a credible data-center player. Nvidia’s agreement in September to take up most of its convertible bond issue underscores MediaTek’s growing strategic importance across the AI ecosystem. |
| Stock | Investment Rationale |
|---|---|
| Narayana Hrudayalaya | Narayana is one of India’s leading private hospital chains, known for delivering complex, high-quality care at a fraction of global costs. The stock declined over the quarter, most recently amid regulatory scrutiny of drug markups in Indian hospitals, which has raised the prospect of margin caps. We believe the concern is overdone for Narayana, as drug margins account for a minor portion of earnings. More importantly, the core of our thesis lies overseas. Having honed its efficiency in one of the world’s most price-competitive healthcare markets, Narayana is highly competitive in developed markets such as the Cayman Islands and the UK, which gives it substantial headroom for growth. |
| Alibaba Group | Alibaba is China’s largest e-commerce group and its leading cloud provider. When we featured it a year ago, our thesis rested on a turnaround in execution and the growth of Alibaba Cloud in China’s AI boom. The cloud business has delivered, with revenue growth accelerating on AI demand, but the share price has been held back by a costly subsidy war in instant commerce, a steep ramp-up in AI capex and, more recently, dilution from a large share placement. In a world where capital carries a real cost, the market is less willing to look through these pressures. We continue to hold the stock, as AI is deepening merchants’ reliance on its ecosystem, but we are watching closely for evidence that this spending translates into returns. |
| Stock | Investment Rationale |
|---|---|
| Samsung Electro-Mechanics | Samsung Electro-Mechanics is Korea’s leading maker of multilayer ceramic capacitors (MLCCs) and advanced chip-packaging substrates, two components now in short supply. Newer AI chips are larger and more complex, requiring bigger substrates and far more capacitors than conventional servers, and few suppliers can meet their specifications. The company holds an estimated share of over 40% in AI-grade MLCCs and has signed long-term supply agreements worth around KRW 3.6 trillion this year.17 With demand outpacing supply, we expect both volume growth and a meaningful uplift in margins as pricing improves. |
| WuXi Biologics | WuXi Biologics is one of the world’s largest contract research, development and manufacturing partners for biologic drugs, supporting pharmaceutical and biotech companies from discovery through to commercial production. AI is accelerating drug discovery, and as more candidates move into development, more work flows to the partners who develop and manufacture them. WuXi is already seeing this: it added a record 123 new integrated projects in the first half of 2026, up 43% y/y, and its total backlog reached USD 25.1 billion.18 Because WuXi follows each molecule from early research through to commercial supply, we expect these wins to compound into manufacturing revenue for years to come. |
| Syrma SGS Technology | Syrma SGS is an Indian electronics manufacturing services (EMS) and design company that builds electronics for customers in the industrial, automotive, healthcare, railway, and defense markets. India is working to build an indigenous electronics supply chain, and as companies that once relied on imported electronics turn increasingly to Indian contract manufacturers, established players with design capabilities stand to benefit most. Syrma serves more than 270 customers across over 20 countries, and it has a track record of managing working capital carefully, an important differentiator in a capital-intensive business. Its order book stood at INR 67 billion in June 2026, up 23% from a year earlier, with growing contributions from defense and railways.19 |
For sophisticated investors only. For informational purposes only. The information presented in the material is not, and may not be relied on in any manner as legal, tax, investment, accounting or other advice or as an offer to sell or a solicitation of an offer to buy an interest in any investment product or any other entity sponsored or managed by Shikhara Investment Management. This material doesn’t constitute and should not be considered as any form of financial opinion or recommendation.
This material is prepared by Shikhara Investment Management LP (“Shikhara”). This material does not constitute an offer to sell or the solicitation of an offer to buy in any state of the United States or other U.S. or non-U.S. jurisdiction to any person to whom it is unlawful to make such offer or solicitation in such state or jurisdiction.
Investment involves risk. Past performance is not indicative of future performance. It cannot be guaranteed that the performance of the investment product will generate a return, and there may be circumstances where no return is generated. Investors could lose all or a substantial portion of any investment made. Before making any investment decision, investors should read the Private Placement Memorandum for details and the risk factors. Investors should ensure they fully understand the risks associated with the investment product and should also consider their own investment objective and risk tolerance level. Investors are advised to seek independent professional advice before making any investment.
Shikhara’s investment products are suitable only for sophisticated investors and require the financial ability and willingness to accept the high risks and lack of liquidity inherent in Shikhara’s investment products. Prospective investors must be prepared to bear such risks for an indefinite period of time. No assurance can be given that the investment objectives of any given investment product will be achieved or that investors will receive a return of their investment.
Certain of the information contained in this material are statements of future expectations and other forward-looking statements. Views, opinions, and estimates may change without notice and are based on a number of assumptions which may or may not eventuate or prove to be accurate. Actual results, performance or events may differ materially from those in such statements.
Certain information contained in this material is compiled from third-party sources. The information and any opinions contained in this document have been obtained from sources that Shikhara considers reliable, but Shikhara does not represent that such information and opinions are accurate or complete, and thus should not be relied upon as such. Furthermore, all opinions are current only as of the date of distribution and are subject to change without notice. Shikhara does not have any obligation to provide revised opinions in the event of changed circumstances. Whereas Shikhara has, to the best of its endeavor, ensured that such information is accurate, complete, and up-to-date, and has taken care in accurately reproducing the information, Shikhara takes no responsibility for the accidental publication of incorrect information, nor for investment decisions taken based on this material. Neither Shikhara nor any of its affiliates makes any representation or warranty, express or implied, as to the accuracy or completeness of the information contained herein, and nothing contained herein should be relied upon as a promise or representation as to past or future performance of any investment product or any other entity.
The MSCI AC Asia ex Japan Index captures large and mid-cap representation across Developed Markets (DM) countries (excluding Japan) and Emerging Markets (EM) countries in Asia. The index covers approximately 85% of the free float-adjusted market capitalization in each country. The MSCI China Index captures large and mid-cap representation across China A shares, H shares, B shares, Red chips, P chips, and foreign listings (e.g. ADRs). The index covers about 85% of the Chinese equity universe.
The contents of this material are prepared and maintained by Shikhara and have not been reviewed by the Securities and Exchange Commission of the United States.
The Shikhara logo and name are trademarks of Shikhara Investment Management LP, registered in Hong Kong, the People’s Republic of China (PRC), Australia, the United Kingdom, the European Union, and the United States.

This website is published exclusively for the purpose of providing general information about the management services carried out by Shikhara Investment Management LP, Shikhara Capital (Hong Kong) Private Limited and its affiliates (collectively “Shikhara Investment Management” or “Shikhara”). The information presented on the website is not, and may not be relied on in any manner as legal, tax, investment, accounting, or other advice or as an offer to sell or a solicitation of an offer to buy an interest in any investment product or any other entity sponsored or managed by Shikhara Investment Management. This website doesn’t constitute and should not be considered as any form of financial opinion or recommendation.
Shikhara Investment Management LP is a Registered Investment Adviser with the U.S. Securities and Exchange Commission, and Shikhara Capital (Hong Kong) Private Limited is licensed by the Hong Kong Securities and Futures Commission. This website does not constitute an offer to sell or the solicitation of an offer to buy in any state of the United States or other U.S. or non-U.S. jurisdiction to any person to whom it is unlawful to make such offer or solicitation in such state or jurisdiction.
Investment involves risk. Past performance is not indicative of future performance. It cannot be guaranteed that the performance of the investment product will generate a return and there may be circumstances where no return is generated. Investors could lose all or a substantial portion of any investment made. Before making any investment decision, investors should read the Prospectus for details and the risk factors. Investors should ensure they fully understand the risks associated with the investment product and should also consider their own investment objective and risk tolerance level. Investors are advised to seek independent professional advice before making any investment.
Shikhara’s investment products are suitable only for sophisticated investors and require the financial ability and willingness to accept the high risks and lack of liquidity inherent in Shikhara’s investment products. Prospective investors must be prepared to bear such risks for an indefinite period of time. No assurance can be given that the investment objectives of any given investment product will be achieved or that investors will receive a return of their investment.
Certain of the information contained in this website are statements of future expectations and other forward-looking statements. Views, opinions, and estimates may change without notice and are based on a number of assumptions which may or may not eventuate or prove to be accurate. Actual results, performance, or events may differ materially from those in such statements.
Certain information contained in this website is compiled from third-party sources. Whereas Shikhara Investment Management has, to the best of its endeavor, ensured that such information is accurate, complete, and up-to-date, and has taken care in accurately reproducing the information, Shikhara Investment Management takes no responsibility for the accidental publication of incorrect information, nor for investment decisions taken based on this website. Neither Shikhara Investment Management nor any of its affiliates makes any representation or warranty, express or implied, as to the accuracy or completeness of the information contained herein, and nothing contained herein should be relied upon as a promise or representation as to past or future performance of any investment product or any other entity.
The contents of this website are prepared and maintained by Shikhara Investment Management and has not been reviewed by the Securities and Exchange Commission of the United States or the Securities and Futures Commission of Hong Kong.
The Shikhara logo and name are trademarks of Shikhara Investment Management LP, registered in Hong Kong, the People’s Republic of China (PRC), Australia, the United Kingdom, the European Union, and the United States.