


May extended a rally that has become increasingly concentrated, and beneath the headline strength sits a market pricing in a great deal of optimism. This month, we explain why we believe the enthusiasm around AI has run ahead of the economics, where that is creating value for us, why a resolution in the Middle East should broaden market leadership, and why we will not compromise portfolio quality to chase a narrow rally.
The MSCI All Country Asia Ex-Japan Index rose 11.26% (in USD terms1) in May, driven by the ongoing AI-led rally in North Asia and supported by easing geopolitical risk as the US and Iran moved toward a longer-term ceasefire. South Korea and Taiwan were the region’s top performers; Indonesia and China were the laggards. Performance was driven overwhelmingly by IT (+29%), while all other sectors delivered low-single-digit or negative returns. Energy and Consumer Staples were the worst-performing sectors.
MSCI China fell 3.03% in May, consolidating after April’s recovery as capital rotated toward onshore technology and North Asian AI plays. President Trump’s May 14-15 state visit to Beijing set a constructive tone but stopped short of any major breakthroughs, and the market’s response was muted. Manufacturing PMI eased to 50.0 (vs 50.3 in April), holding just at the expansion threshold, pressured by soft domestic demand and elevated input costs tied to the Middle East conflict.2 Non-manufacturing PMI returned to expansion at 50.1 (vs 49.4), helped by firmer services and construction.3 Notably, mainland investors turned net sellers of Hong Kong equities for the first time since June 2023, as a near-40% rally in the onshore STAR 50 since early April pulled funds away from the city.4
Indian equities were broadly flat, slipping 0.58%, as resilient domestic data was offset by persistent foreign selling and a weak currency. Provisional estimates released on May 29 placed full-year FY26 GDP growth at around 7.6%, the strongest pace since FY22, with fourth-quarter (January to March) growth moderating to roughly 7.3%.5 Foreign portfolio investors remained net sellers, extending this year’s outflows, while domestic institutions continued to absorb the pressure. The rupee stayed near record lows around 95 per dollar, and elevated crude prices kept upward pressure on imported inflation through much of the month.
South Korea was again the region’s standout, surging 35.29% as a record-breaking export performance reinforced the AI-driven rally. May exports rose 53.2% year-over-year to a record USD 87.8 billion, the fastest annual pace in more than four decades, led by semiconductor shipments that jumped 169.4% to a record USD 37.2 billion.6 The trade surplus reached a record USD 26.95 billion. On May 28, the Bank of Korea raised its 2026 GDP growth forecast to 2.6% from 2.0%, citing the chip boom.7 The KOSPI hit successive record highs, though Samsung Electronics and SK Hynix now make up a record 42% of the index, underscoring rising concentration.8
Taiwanese equities gained 16.53%, extending their AI-led advance as the semiconductor super-cycle continued to power the market to fresh record highs. TSMC led the charge on robust AI demand and strong pricing power and now accounts for more than 40% of the TAIEX, mirroring the concentration seen in Korea.9 However, late in May, the market saw some profit-taking after its strong run, though the underlying export and earnings backdrop remained firm.
Within ASEAN, performance diverged sharply. Thailand (+4.99%) and Singapore (+4.24%) led, while the Philippines (-1.03%) and Malaysia (-1.74%) edged lower. Indonesia was the clear outlier, tumbling 12.66% in its sixth straight monthly decline. The sell-off intensified around MSCI’s May 29 semi-annual review, which removed 19 Indonesian companies from its global indexes without any additions, raising fears of a possible downgrade toward frontier status.10 The rupiah hit a record low near 18,000 per dollar, while fiscal and sovereign-rating concerns, together with President Prabowo’s move to bring key commodity exports under state control, weighed heavily on certain sectors.
The risk in AI today is not stretched multiples but stretched earnings expectations, and we will not chase momentum or low-quality names into forecasts that simply extrapolate front-loaded demand.
The excitement that gripped markets in March and April was understandable. Agentic AI adoption was surging, token consumption was surging, and demand for legacy technology was being pulled forward as customers pre-empted rising prices. What follows, as is often the case with new technology, is a more sober assessment of cost versus benefit. Uber is a prime example. Its president recently observed that higher token consumption has not yet translated into a proportionate increase in useful features shipped to users, after the company exhausted its entire 2026 budget for AI coding tools in just four months.11 As we’ve said before, adoption will come, but it hinges on two things: 1) cost per token has to come down to make broad deployment economic, and 2) useful applications and beneficial use cases need to emerge whose returns justify the spend for the end user.
We would characterize the current excess as an earnings bubble rather than a valuation one. The scale of optimism is striking. Morgan Stanley, for example, has roughly doubled its estimate of 2026 hyperscaler capital expenditure to around USD 805 billion, lifted its 2026 S&P 500 earnings growth forecast from 17% to 23%, and notes that consensus now expects 2026 earnings for Korean equities, home to many AI suppliers, to grow by some 235%.12
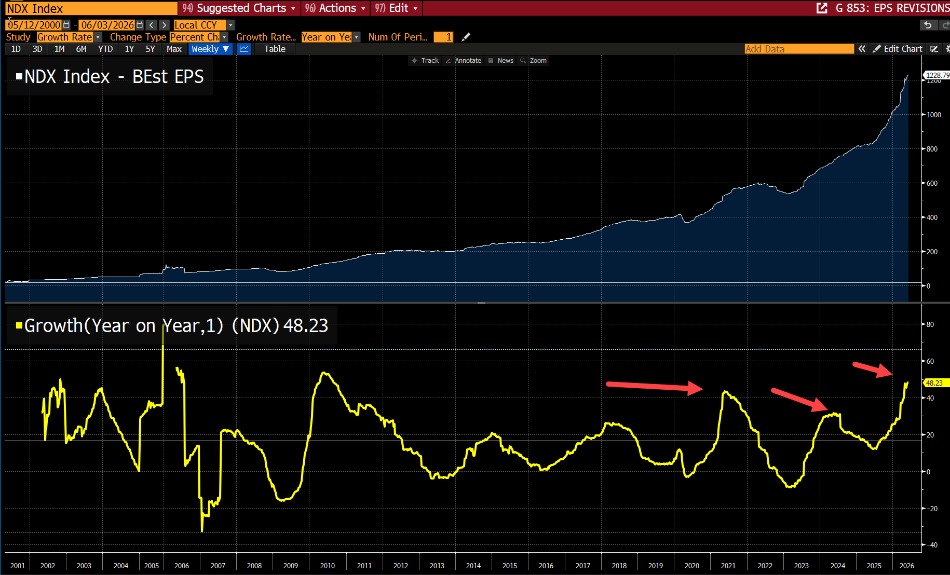
Much of this, in our view, is the present being extrapolated into the future. Sell-side analysts typically take industry-association projections, haircut them by 15 to 20 percent for comfort, and still arrive at numbers clustered around the same optimistic path. Tellingly, the owners of these assets are moving to monetize the enthusiasm, with a heavy slate of primary supply arriving, from SpaceX’s imminent listing to the OpenAI and Anthropic IPO pipeline, and the revenues behind such offerings typically lag the valuations at which they come to market.
There is a more specific flaw in the bull case for the AI enablers, whose share prices assume that hyperscaler capital expenditure keeps compounding through 2026 and 2027. What that assumption overlooks is that the spending is no longer small. The top five hyperscalers spent around USD 858 billion between 2023 and 2025.13 A further ~USD 800 billion is slated for 2026, and likely another USD 1 trillion for 2027, taking cumulative outlays to roughly USD 2.6 trillion over five years.14 In the early innings of a new technology, when the sums are modest, the return on investment (ROI) is easily set aside. But once the cumulative bill reaches this scale, boards and investors will find it far harder to avoid the question. Moreover, a tougher funding environment, with tighter private capital and higher rates, will only sharpen the focus on ROI, and that reckoning still lies ahead.
For the companies consuming AI, we expect demand to slow over the second half of this year as they weigh the returns on their token spending, and as front-loaded purchases of tech hardware begin to normalize. Front-loading of both AI hardware and orders rushed ahead of potential new tariffs has flattered recent production and shipment data, and the payback, alongside the paring back of fuel subsidies, is likely to weigh on activity in the months ahead. That is where we see recent upgrades may give way to downgrades.
We hold the strongest AI enablers, are trimming winners where optimism looks extreme, and see deeper value in the mispriced adopters of AI.
Within AI infrastructure, which represents around 30% of the portfolio as of writing in early June, we have focused on the best operators and remained selective. We are particularly confident in TSMC, where the constraint has been supply bottlenecks rather than aggressive pricing, and we continue to favor names such as MediaTek and Alchip, which stand to gain share as Google and Amazon direct more of their spending toward their own custom silicon rather than merchant GPUs. Memory has performed well and looks reasonable on 2026 supply and demand, but the share-price moves have been strong enough that we have been taking some profits; the recent spike in end-product prices owed much to shortages, which flattered earnings and left multiples looking optically cheap.
As we write in early June, a correction in the AI hardware names that had run hardest has also caught a number of high-quality businesses with little connection to AI infrastructure, including Korean cosmetics, Chinese internet, and ASEAN internet names, despite their already modest valuations. We see this as an opportunity on both fronts: to add selectively within AI infrastructure at better prices, and to build positions in strong non-AI infrastructure franchises such as Tencent, Baidu, and Alibaba.
The two concerns that weighed on AI adopters over the past six months are now fading. The fear that agentic AI would displace these businesses has not played out, as agents are being used to enhance their performance and the models themselves have moved toward enterprise applications. The second concern, the Middle East, we turn to below.
A resolution is now firmly in policymakers’ interest, and we expect it to broaden leadership from technology into the beaten-down cyclicals and consumer names we favor.
The conflict has lasted far longer than most expected. We had thought a resolution might come as early as March, but the reason for the delay is clear in hindsight. Because the US is largely self-sufficient in energy, the rise in oil prices has been absorbed rather than allowed to choke off activity. If anything, the economy has strengthened even as the conflict dragged on, and higher energy costs have done little to dampen demand. US gasoline consumption in April was almost unchanged from a year earlier, and Americans kept spending and flying even as air fares rose around 21% on higher fuel costs.15 The cost increases were real, but they did not inflict the broad economic damage that forces a policymaker’s hand. With no such pressure, Washington has been able to negotiate from a position of strength, and buoyant markets only emboldened that stance.
What is changing now is the arrival of genuine pressure points, and the clock is ticking on oil. Estimates show that the effective closure of the Strait of Hormuz has removed around 14% of daily global supply, the largest reduction on record, yet Brent has held below USD 100 only because the world entered the conflict with unusually high inventories.16 With stocks now drawing at roughly five million barrels a day, it warns that physical availability could tighten materially if the Strait is still closed by early September, potentially pushing prices toward USD 130 to 150.17
At the same time, US inflation expectations have risen, with the OECD lifting its 2026 forecast well above the Federal Reserve’s, and Treasury yields have climbed to multi-year highs.18 A robust May payrolls report (the strongest three-month run since early 2024) has reinforced the shift. Markets have priced out rate cuts entirely and increasingly see the Federal Reserve’s next move as a hike, with some pricing in an increase as early as the third quarter. And the hawkish turn is not confined to the US: the Bank of Korea held at 2.50% with a pointedly hawkish message and two members dissenting in favor of a hike, while the Bank of Japan is expected to raise rates in June. In effect, the bond market is doing the tightening and nudging the administration toward a settlement.
Since March, the dominant trade has been to own technology, with its dollar-based revenues and rising estimates, and to avoid the consumer cyclicals exposed to inflation. Those cyclicals have become inexpensive even as their underlying momentum is set to improve over the next two or three quarters as a resolution comes into view. A genuine de-escalation would be felt most in the parts of the market that have been left behind, and we expect a revival in non-technology sectors.
The rally has been historically narrow, and we see more risk than reward in participating in the momentum.
It is worth pausing on how narrow this market has become. Over the past six months, the IT sector returned 107%, and Industrial returned 28%, while the remaining sectors posted single-digit or negative returns.19 In May alone, South Korea and Taiwan accounted for the bulk of the index’s gain, while by sector, only IT rose meaningfully.
MSCI Asia ex Japan Index returns (Period: November 28, 2025 – May 29, 2026)
| Country | 6M Return % | Sector | 6M Return % |
|---|---|---|---|
| South Korea | 146.00 | Information Technology | 106.86 |
| Taiwan | 69.94 | Industrials | 28.04 |
| Thailand | 29.68 | Materials | 6.50 |
| Malaysia | 11.84 | Real Estate | 5.28 |
| Hong Kong | 7.67 | Utilities | 3.65 |
| Singapore | 7.14 | Financials | 2.48 |
| Philippines | -4.84 | Energy | -4.40 |
| China | -9.51 | Consumer Staples | -7.16 |
| India | -11.53 | Health Care | -8.73 |
| Indonesia | -35.71 | Consumer Discretionary | -9.27 |
| Communication Services | -22.18 |
That narrowness is not only a market phenomenon. Even in Korea, underlying activity has begun to soften, with both industrial production and retail sales weakening in April while the chip-driven index continued to set fresh records. Index-level returns of this kind say more about a handful of large exporters than about broad-based strength, and participating in such a rally without regard to quality or valuation simply imports that risk into the portfolio.
That is not our approach, and we are candid about where this year has been difficult. We entered 2026 with a higher weighting in consumer discretionary and a constructive view on agentic AI for AI adopters. The prolonged conflict and a larger-than-anticipated earnings upgrade in technology worked against both, and Korea, a significant contributor for us last year, detracted as the prior year’s winners lagged. Positioning can shift quickly, and performance is ultimately a function of process. Our downside protection lies in the quality of what we own: great executors with strong balance sheets and genuine technological expertise, held with a long-term horizon. We treat the benchmark as a reference rather than a constraint, with the objective of adding meaningful alpha over a full three-year cycle, and we are wary of approaches that fixate on near-term, single events and forfeit long-term compounding. Several of our best outcomes took roughly two years to play out and delivered multiples of our entry price, well after many shorter-horizon investors had sold.
In the parts of Asia less driven by AI, policy direction increasingly determines where we allocate. India has been constructive, easing tax norms for investors and working to attract foreign direct investment (FDI). Indonesia has moved in the opposite direction, with a decision to route key commodity exports through a state entity that effectively sets prices, which we regard as a negative signal on governance and capital allocation.
Vietnam, by contrast, is an example of an economy doing the right things. Growth is forecast at around 8.5% in 2026, led by an acceleration in public investment that is crowding in private capital, and supported by reform efforts aimed at easing capital-raising bottlenecks and administrative friction.20 The response to the energy shock has been proactive, with roughly VND 39 trillion (~USD 1.5 billion) in fuel tax and fee reductions and use of the price-stabilization fund to contain inflation, while the central bank has balanced support for growth with prudent macroprudential measures. With FTSE Russell’s upgrade to emerging-market status taking effect in September, we see Vietnam as one of the more compelling structural stories in the region.
In summary, this is a market that has rewarded a very narrow set of winners and priced in a great deal of optimism. We have seen this pattern before: capital moves in herds from one extreme to the other, and the moments of greatest enthusiasm are rarely the best moments to add risk. We are not bearish, but we are selective and will continue to own well-positioned businesses and take profits where expectations have outrun fundamentals. The portfolio is built to compound over a full cycle, and we believe the current positioning will be rewarded as earnings expectations normalize and leadership broadens.
For sophisticated investors only. For informational purposes only. The information presented in the material is not, and may not be relied on in any manner as legal, tax, investment, accounting or other advice or as an offer to sell or a solicitation of an offer to buy an interest in any investment product or any other entity sponsored or managed by Shikhara Investment Management. This material doesn’t constitute and should not be considered as any form of financial opinion or recommendation.
This material is prepared by Shikhara Investment Management LP (“Shikhara”). This material does not constitute an offer to sell or the solicitation of an offer to buy in any state of the United States or other U.S. or non-U.S. jurisdiction to any person to whom it is unlawful to make such offer or solicitation in such state or jurisdiction.
Investment involves risk. Past performance is not indicative of future performance. It cannot be guaranteed that the performance of the investment product will generate a return, and there may be circumstances where no return is generated. Investors could lose all or a substantial portion of any investment made. Before making any investment decision, investors should read the Private Placement Memorandum for details and the risk factors. Investors should ensure they fully understand the risks associated with the investment product and should also consider their own investment objective and risk tolerance level. Investors are advised to seek independent professional advice before making any investment.
Shikhara’s investment products are suitable only for sophisticated investors and require the financial ability and willingness to accept the high risks and lack of liquidity inherent in Shikhara’s investment products. Prospective investors must be prepared to bear such risks for an indefinite period of time. No assurance can be given that the investment objectives of any given investment product will be achieved or that investors will receive a return of their investment.
Certain of the information contained in this material are statements of future expectations and other forward-looking statements. Views, opinions, and estimates may change without notice and are based on a number of assumptions which may or may not eventuate or prove to be accurate. Actual results, performance or events may differ materially from those in such statements.
Certain information contained in this material is compiled from third-party sources. The information and any opinions contained in this document have been obtained from sources that Shikhara considers reliable, but Shikhara does not represent that such information and opinions are accurate or complete, and thus should not be relied upon as such. Furthermore, all opinions are current only as of the date of distribution and are subject to change without notice. Shikhara does not have any obligation to provide revised opinions in the event of changed circumstances. Whereas Shikhara has, to the best of its endeavor, ensured that such information is accurate, complete, and up-to-date, and has taken care in accurately reproducing the information, Shikhara takes no responsibility for the accidental publication of incorrect information, nor for investment decisions taken based on this material. Neither Shikhara nor any of its affiliates makes any representation or warranty, express or implied, as to the accuracy or completeness of the information contained herein, and nothing contained herein should be relied upon as a promise or representation as to past or future performance of any investment product or any other entity.
The MSCI AC Asia ex Japan Index captures large and mid-cap representation across Developed Markets (DM) countries (excluding Japan) and Emerging Markets (EM) countries in Asia. The index covers approximately 85% of the free float-adjusted market capitalization in each country. The MSCI China Index captures large and mid-cap representation across China A shares, H shares, B shares, Red chips, P chips, and foreign listings (e.g. ADRs). The index covers about 85% of the Chinese equity universe.
The contents of this material are prepared and maintained by Shikhara and have not been reviewed by the Securities and Exchange Commission of the United States.
The Shikhara logo and name are trademarks of Shikhara Investment Management LP, registered in Hong Kong, the People’s Republic of China (PRC), Australia, the United Kingdom, the European Union, and the United States.

This website is published exclusively for the purpose of providing general information about the management services carried out by Shikhara Investment Management LP, Shikhara Capital (Hong Kong) Private Limited and its affiliates (collectively “Shikhara Investment Management” or “Shikhara”). The information presented on the website is not, and may not be relied on in any manner as legal, tax, investment, accounting, or other advice or as an offer to sell or a solicitation of an offer to buy an interest in any investment product or any other entity sponsored or managed by Shikhara Investment Management. This website doesn’t constitute and should not be considered as any form of financial opinion or recommendation.
Shikhara Investment Management LP is a Registered Investment Adviser with the U.S. Securities and Exchange Commission, and Shikhara Capital (Hong Kong) Private Limited is licensed by the Hong Kong Securities and Futures Commission. This website does not constitute an offer to sell or the solicitation of an offer to buy in any state of the United States or other U.S. or non-U.S. jurisdiction to any person to whom it is unlawful to make such offer or solicitation in such state or jurisdiction.
Investment involves risk. Past performance is not indicative of future performance. It cannot be guaranteed that the performance of the investment product will generate a return and there may be circumstances where no return is generated. Investors could lose all or a substantial portion of any investment made. Before making any investment decision, investors should read the Prospectus for details and the risk factors. Investors should ensure they fully understand the risks associated with the investment product and should also consider their own investment objective and risk tolerance level. Investors are advised to seek independent professional advice before making any investment.
Shikhara’s investment products are suitable only for sophisticated investors and require the financial ability and willingness to accept the high risks and lack of liquidity inherent in Shikhara’s investment products. Prospective investors must be prepared to bear such risks for an indefinite period of time. No assurance can be given that the investment objectives of any given investment product will be achieved or that investors will receive a return of their investment.
Certain of the information contained in this website are statements of future expectations and other forward-looking statements. Views, opinions, and estimates may change without notice and are based on a number of assumptions which may or may not eventuate or prove to be accurate. Actual results, performance, or events may differ materially from those in such statements.
Certain information contained in this website is compiled from third-party sources. Whereas Shikhara Investment Management has, to the best of its endeavor, ensured that such information is accurate, complete, and up-to-date, and has taken care in accurately reproducing the information, Shikhara Investment Management takes no responsibility for the accidental publication of incorrect information, nor for investment decisions taken based on this website. Neither Shikhara Investment Management nor any of its affiliates makes any representation or warranty, express or implied, as to the accuracy or completeness of the information contained herein, and nothing contained herein should be relied upon as a promise or representation as to past or future performance of any investment product or any other entity.
The contents of this website are prepared and maintained by Shikhara Investment Management and has not been reviewed by the Securities and Exchange Commission of the United States or the Securities and Futures Commission of Hong Kong.
The Shikhara logo and name are trademarks of Shikhara Investment Management LP, registered in Hong Kong, the People’s Republic of China (PRC), Australia, the United Kingdom, the European Union, and the United States.