


May was a month of crosscurrents. Oil staged its sharpest fall since the pandemic as the Middle East de-escalated, yet Indian equities ended flat and foreign investors kept selling. Look past the headline, though, and the disconnect is the story: a 7.7% FY26 GDP growth print and a multi-year capex cycle on one side, a market left behind by a narrow AI rally on the other. In this edition, we explain why that gap is an opportunity, where we see India’s real winners hiding beneath the index. Enjoy!
The MSCI India Index returned -0.58% (in USD terms1) in May, giving back a small portion of April’s sharp rebound. By sector, Industrials and Materials were the top performers, while Energy and Utilities were the laggards. Foreign portfolio investors (FPIs) remained net sellers for a third consecutive month, withdrawing approximately USD 3.5 billion from Indian equities in May.2 This brings cumulative FPI outflows for 2026 to roughly USD 21 billion, already well in excess of the USD 18.9 billion withdrawn in all of 2025 and among the heaviest selling on record.3
The defining development of the month was a sharp reversal in oil. Brent crude fell approximately 19%, its steepest monthly decline since the early days of the Covid pandemic, retreating from near USD 115 per barrel to close the month around USD 93, after the US and Iran made further progress on a memorandum of understanding to pause hostilities.4 The accompanying rotation out of defensive, bond-proxy sectors and back toward cyclicals left Utilities and Consumer Staples among the weakest performers, alongside Energy.
Despite the improving oil backdrop, FPIs continued to sell, underscoring that the headwind is as much about the global rotation toward AI-exposed markets as it is about India-specific fundamentals. As in prior months, domestic institutional investors absorbed the bulk of outflows, while steady systematic inflows continued to underpin the market. The rupee remained under pressure, trading near INR 92 per US dollar, reflecting a combination of foreign outflows and an elevated, albeit improving, energy import bill.5
Domestic activity indicators remained resilient. The manufacturing PMI rose to a three-month high of 55.0 in May (from 54.7 in April), with new orders and output expanding at their fastest pace since February on the back of strong domestic demand and infrastructure activity.6 The one note of caution was input costs, which rose at close to a four-year high as the earlier surge in energy and materials prices continued to filter through supply chains. On the inflation front, headline consumer price index (CPI) inflation rose to 3.48% y/y in April (vs 3.40% in March), remaining comfortably within the RBI’s 2-6% tolerance band, though food inflation accelerated to 4.20%, and the broader trend is gently higher as energy prices feed through.
Finally, the month’s macro picture was capped by the release of full-year FY26 GDP data in early June, which surprised to the upside at 7.7%, up from 7.1% in FY25, comfortably retaining India’s position as the fastest-growing major economy.7 Growth was led by the manufacturing and services sectors, with full-year manufacturing expanding 10.7% and services remaining the primary engine, supported by strength in trade, transport, and financial and professional services. Momentum held into the final quarter, with Q4 GDP growth of 7.8%, while a marked pickup in investment activity, including a sharp rise in private investment announcements over the year, points to a broadening of the capital expenditure cycle.
India’s underlying economy remains among the strongest in the region, yet the market has been left behind in a narrow, AI-driven rally. We see that disconnect as the opportunity.
The starting point for any discussion on India today is the disconnect between a robust real economy and a market that has badly lagged. The strong FY26 growth print is not, in our view, a single good quarter but evidence of a durable, multi-year capital expenditure cycle. India’s investment rate is expected to accelerate toward a peak of around 37.5% of GDP by FY30, from roughly 34.6% currently, spanning energy, transmission, defense, railways, data centers, and semiconductors, and increasingly funded by corporate balance sheets rather than the government budget.8 It is precisely this kind of structural driver that the market’s current pessimism overlooks.
And yet, over the past six months, India has been one of the weakest markets in the region, with negative returns of 11.53% while the broader Asia region was carried higher by a narrow set of North Asian technology exporters.9 In our May Asia commentary, we discuss the historic narrowness of this rally and why we choose not to chase momentum. For India specifically, the more useful question is why a market with such strong fundamentals has been so out of favor, and what resolves it.
A shortage of foreign capital inflows, not weak fundamentals, explains India’s underperformance, and it keeps us mindful of currency and rate pressures even as the domestic story stays intact.
Part of the answer is capital flows. Foreign portfolio investors have now sold Indian equities for a third consecutive month, with cumulative 2026 outflows already exceeding the full-year 2025 total.10 The picture on direct investment is similar. US capital is increasingly content to stay at home, European capital likewise, and the Chinese outbound investment that is moving offshore is heading mostly to ASEAN, with only selective flows into India. For a structural trade-deficit economy, this shortfall of inflows matters: it puts persistent pressure on the currency, with the rupee trading near record lows through May.
This shapes how we read policy. Time and again, the RBI has shown it will prioritize currency stability over growth, and its early-June meeting reinforced that. The central bank held rates and kept a neutral stance, but with real rates close to zero and the FY27 inflation forecast raised, the market is increasingly positioned for rate hikes rather than cuts in the coming year.
The authorities have moved aggressively to defend the rupee on a second front, abolishing capital gains and withholding taxes on government bonds for foreign investors, widening the fully accessible route to long-dated government securities, and introducing concessional swap and deposit facilities, a package that some estimate could attract USD 40 to 50 billion of inflows and stabilize the currency.11 We read this as confirmation of our view that policy priority is on the currency, and the cost is rates staying higher for longer, alongside continued fiscal consolidation.
Growth, too, is expected to moderate in FY27 as energy and weather shocks bite. That combination keeps us cautious on the rate-sensitive, domestically oriented parts of the market and biases us toward businesses whose earnings are denominated in or driven by demand from outside India.
India’s recent trade agreements, combined with global supply-chain diversification, set up a multi-year manufactured-export story that is one of our highest-conviction themes.
This is where we are most constructive. India’s bilateral trade agreements, most recently the EU free trade agreement reached in January and the US interim deal in February, are positive developments in which India secures access to large external markets in exchange for opening its own. We expect these to play out gradually but powerfully, in order flow and component sourcing, as original equipment manufacturers in those markets look to diversify their supply chains yet again away from single-source dependence on China. The China plus one shift is no longer a slogan; increasingly, large global buyers are actively qualifying alternative suppliers, and Indian companies are proving to be reliable ones.
While the EU and US agreements have been the most prominent, they sit atop a far broader trade architecture that India has been steadily assembling in recent years. Since 2020, India has concluded or brought into force agreements with the UAE, Australia, Mauritius, the EFTA bloc, the UK, Oman, and New Zealand, several of which are comprehensive deals covering goods, services, and investment. Taken together, this widening web of agreements is progressively opening large external markets to Indian exporters across a wide range of sectors.
| Agreement | Signed | In force | Headline provisions |
|---|---|---|---|
| India-Mauritius CECPA (Comprehensive Economic Cooperation and Partnership Agreement) | 22 Feb 2021 | 1 Apr 2021 | 310 Indian / ~615 Mauritian lines; services in 95 Indian sub-sectors; quotas for Mauritian sugar, apparel, rum, beer; first India–Africa deal |
| India-UAE CEPA (Comprehensive Economic Partnership Agreement) | 18 Feb 2022 | 1 May 2022 | >11,000 lines; >90% Indian goods duty-free; concessional gold/precious-metals channel; services, investment, digital |
| India-Australia ECTA (Economic Cooperation and Trade Agreement) | 2 Apr 2022 | 29 Dec 2022 | Australia ~100% lines (96%+ immediate); India ~70–90% lines (raw materials, quotas); services, mobility, working-holiday visas |
| India-EFTA TEPA (Trade and Economic Partnership Agreement) | 10 Mar 2024 | 1 Oct 2025 | India duty access ~99.6% of EFTA value; India concessions on ~82.7% of lines; binding-style US$100bn / 15-yr investment + 1m-jobs target |
| India-UK FTA (Free Trade Agreement) | 24 Jul 2025 | Not yet in force; expected 2026 | UK 100% lines over 7 yrs (99.6% of Indian value); India ~80%+ lines over 10 yrs; whisky 150→75→40%; autos to 10% under TRQ; Double Contribution Convention; mobility |
| India-Oman CEPA | 18 Dec 2025 | 1 June 2026 | India ~99.4% of export value duty-free to Oman (98.1% of Oman’s lines); India opens ~78% of its lines (~95% of imports); textiles, gems & jewelry, leather, engineering, pharma, food processing |
| India-New Zealand FTA | 27 Apr 2026 | Not yet in force | NZ 100% of Indian export lines duty-free (~57% from day one); India ~70% of lines (~95% of trade value; dairy, sugar excluded); services & mobility (5,000 work visas), ~US$20bn NZ investment / 15 yrs |
| India-EU FTA | Concluded 27 Jan 2026 | Expected early 2027 | India ~96.6% of lines / EU ~99.3%; India labor-intensive exports (textiles, leather, gems & jewelry, ~US$33bn) to zero EU duty; India cars 110→10% over 5 yrs, wine & spirits cuts; CBAM unresolved outside FTA |
| India-US Interim Framework / BTA (Bilateral Trade Agreement) | Framework 2/6 Feb 2026 | Pending (interim) | US reciprocal tariff cut 25→18% (was 50% incl. Russian-oil penalty, now removed); India to open industrial + range of ag goods; tech cooperation |
The evidence that this is structural, not cyclical, is mounting. India’s export profile has already begun to shift up the value chain: smartphones became the country’s single largest exported commodity last year, and the economy is transitioning from assembly-led manufacturing toward a deeper, ecosystem-based model with genuine domestic value addition.12 Policy is reinforcing the trend, from the semiconductor mission now in its second phase to an addressable domestic chip market projected at USD 100-110 billion by 2030.13 This is the spine of our positioning: we are primarily biased toward good exporters, particularly in engineered or machined goods, as well as healthcare, that are direct beneficiaries of these agreements and of the diversification of global supply chains.
The most expensive, most-owned parts of the index are the most exposed to AI disruption and slowing urban consumption. We think that the real opportunity sits beneath the surface, in genuinely competitive businesses and idiosyncratic opportunities in tier-2 and -3 cities.
We hold a more cautious view on AI’s impact on India than the consensus, and it differs from the supplier-led optimism shaping North Asia, which we cover in our May Asia commentary. India is not primarily an AI hardware enabler; its exposure is on the services and adoption side, and there we see AI as a net negative for the broad market. As AI-driven competition compresses the economics of legacy IT services and questions the long-term competitiveness of businesses that have long earned premium multiples, we expect a valuation de-rating to work through the index. This is most acute in large-cap consumption names. Many of these traded on historically high multiples of 40 to 50 times earnings, justified by an assumption of durable, uncontested growth. With urban consumption likely to slow and competitiveness in question, we think the market will be increasingly reluctant to underwrite those multiples.
But the other side of this is far more interesting. There is a part of India made up of genuinely competitive businesses that are only now starting to gain share, and that stand to scale up dramatically by deploying AI rather than being disrupted by it. These are what we call “last man standing” franchises.
Two of our long-standing holdings illustrate the point. Sansera Engineering has steadily evolved from an auto-components supplier into a diversified precision-engineering business with growing exposure to aerospace, defense, and non-automotive segments, exactly the kind of supplier the China plus one diversification is reaching for. Narayana Hrudayalaya has shown that its low-cost, high-efficiency hospital model can travel beyond India, and is reinvesting strong cash flows into its most aggressive capacity expansion in years. Looking at how much these businesses have evolved over just a few years, our focus is on this combination of medium-term thematic exposure and strong bottom-up stories, backed by management who are strong executors.
These franchises are part of a broader India that sits beneath the headline index, and the same is true of the tier-2 and tier-3 stories that rarely make the front page. These are idiosyncratic opportunities benefiting from a genuine improvement in the conditions for doing business: better physical infrastructure, improving law and order, and the productivity dividend from digitization and GST-driven formalization. The scale of the infrastructure buildout underpinning this is significant. Railway capital expenditure has risen from roughly INR 660 billion a decade ago to nearly INR 2.72 trillion in FY26, and the dedicated freight corridor has already cut transit times on its western stretch from around 50 hours to 12 to 16 hours.14 These are the kinds of gains that create pools of demand and efficiency that did not exist five years ago, and they are largely uncorrelated with the AI anxieties weighing on the metros.
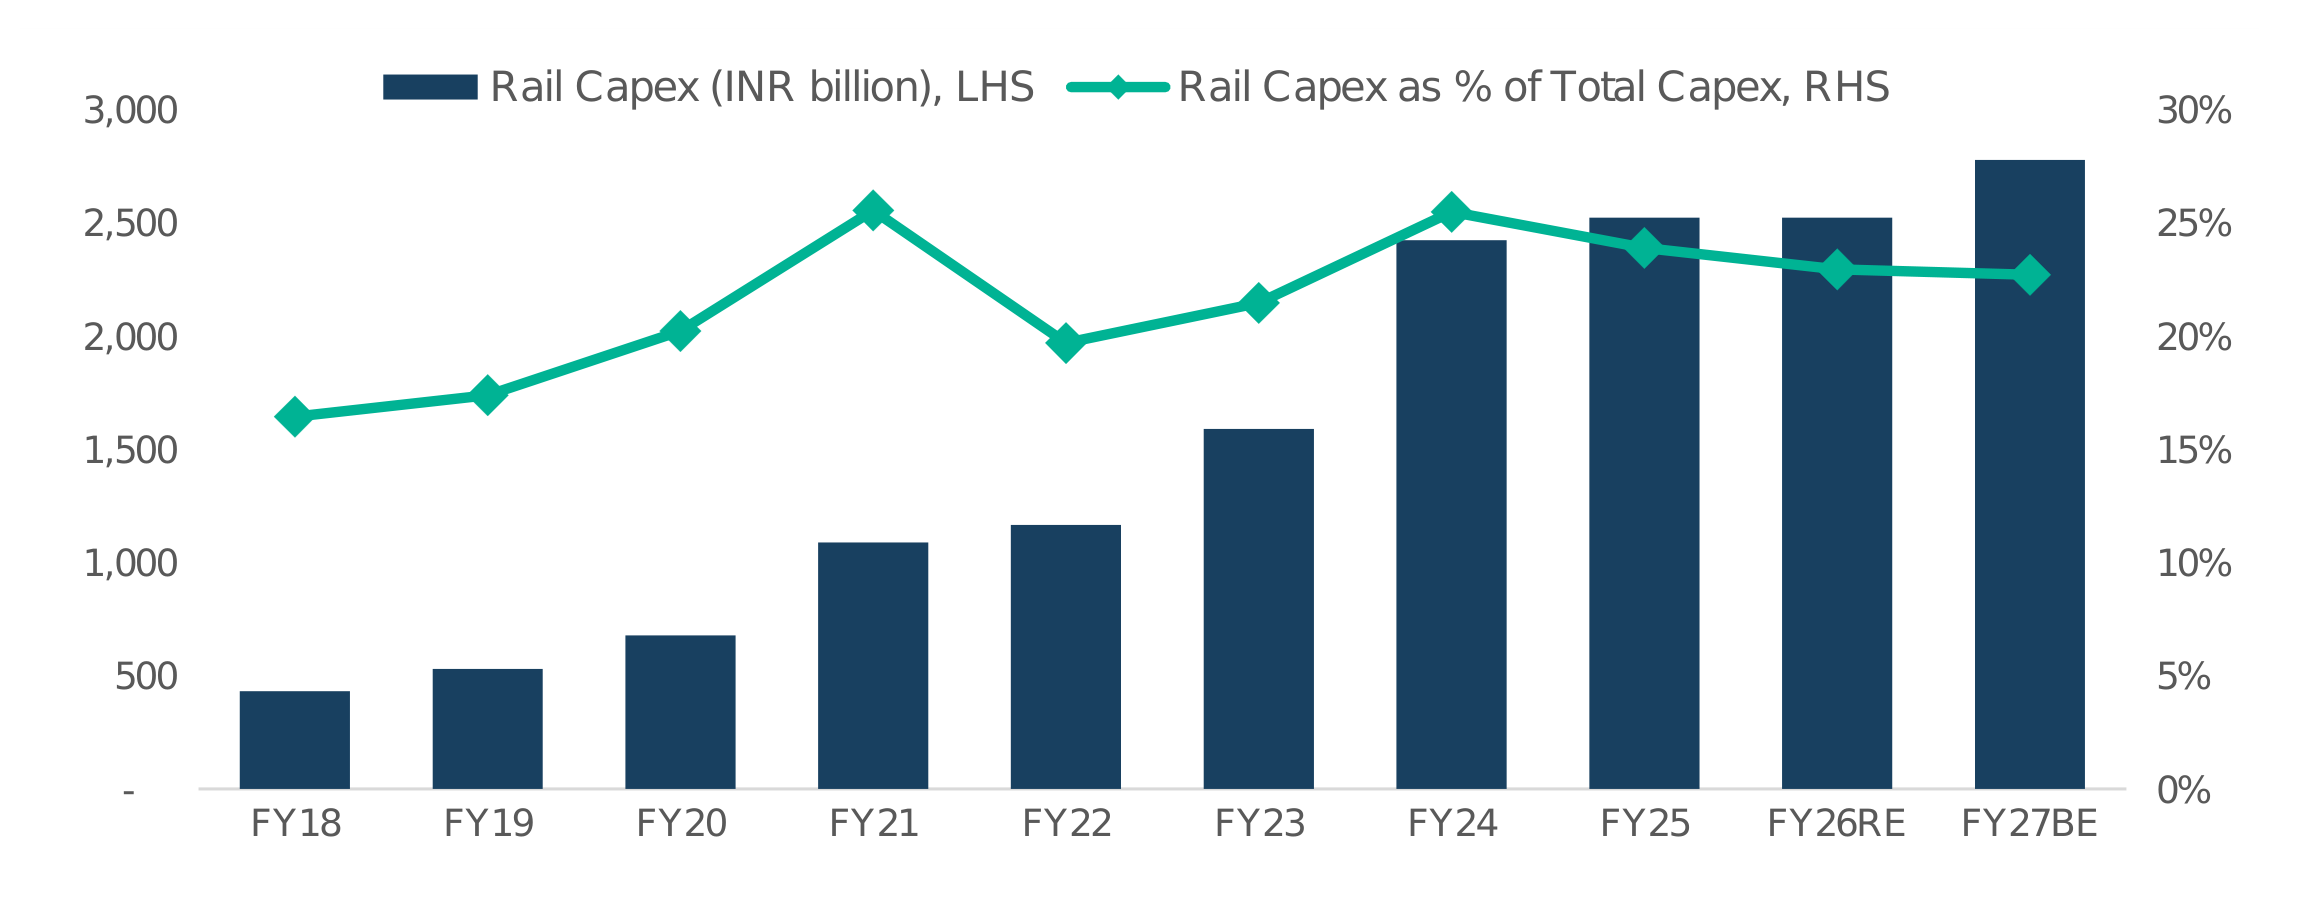
We are, however, mindful of near-term risks. Forecasts point to the risk of a severe El Niño, which, combined with the lingering energy shock, would weigh most heavily on the informal economy, the rural and urban informal workers who together account for roughly two-thirds of consumption. This reinforces, rather than changes, our positioning and is another reason to favor exporters and defensive healthcare names over domestically driven rural consumption. At the same time, we would look to add selective idiosyncratic domestic stories where the bottom-up case is strongest.
In summary, India presents a rare combination today: a strong underlying economy trading at a discount to its own history because foreign capital has looked elsewhere and an AI narrative has been applied indiscriminately. We are not trying to time the return of flows, but we are positioned for where we have genuine conviction: the exporters and manufacturers who win from China plus one and India’s new trade agreements, the healthcare franchises compounding through capacity and competitiveness, and the emerging businesses using AI to scale rather than being scaled by it.
Here, we capture some on-the-ground observations from our India team – notes and signals that serve as practical barometers for demand, sentiment, and trends.
India’s electric vehicle (EV) market has gained strong momentum in recent months, especially in passenger vehicles. In May 2026, EV penetration in the passenger vehicle segment reached 6.9%, the highest level in more than a year, with 21,953 EVs sold out of total passenger vehicle sales of 317,354 units.15 This marks a sharp rise from 4.1% in January and 4.2% in February.16 Adoption picked up steadily through March, when penetration reached 5.9%, and continued rising in April before peaking in May.
Rising fuel costs have done what years of policy nudges could not fully accomplish – push Indian consumers decisively toward EVs. At the same time, improved affordability and faster launch cycles across manufacturers and price points have made EVs more accessible.
Tata Motors, for instance, has expanded its EV lineup from early products such as the Nexon EV, Tiago EV, and Tigor EV to newer models like the Punch EV, an affordable and feature-rich micro-SUV. Tata is consistently launching and has an aggressive launch pipeline, such as the Sierra EV and the Tata Avinya. Mahindra & Mahindra (M&M) is planning for 20% EV contribution in the medium term.17 Meanwhile, global automakers including BYD, MG, Hyundai, Kia, and Volvo have either launched or announced premium and mid-segment EVs, signaling long-term commitment to the Indian market.
The shift is not limited to cars. Electric two-wheelers accounted for 8.9% of motorcycle and scooter sales in May, up from 6.7% in January, with 144,451 units sold during the month.18 This segment has already seen relatively healthy EV adoption, largely because range anxiety is less of a concern than it is for passenger vehicles. However, the sharp rise in petrol prices is likely to accelerate adoption further, especially since two-wheeler buyers tend to be more sensitive to fuel costs.
The roughly 3 percentage point increase in passenger vehicle EV penetration within just four months is significant for a market where charging infrastructure is still developing.19 If fuel prices remain high and automakers continue introducing affordable models, India’s passenger EV penetration could realistically cross 10% by the end of 2026. That would mark an important milestone for a market where such a level of adoption seemed some distance away only a year ago.
This is the kind of shift we watch closely from on the ground, and it illustrates how some of the themes we’ve touched on connect. The same elevated fuel costs that are pressuring the headline consumer are also accelerating a structural shift towards electrification, benefiting a few of our holdings. Sona Comstar has been building out its EV components business, and Sansera, which we mentioned earlier, is moving into precision parts for newer mobility platforms. We own these businesses because they’re competitive, well-run franchises that are exposed to structural growth themes. And that is the approach that we take across our portfolio.
For sophisticated investors only. For informational purposes only. The information presented in the material is not, and may not be relied on in any manner as legal, tax, investment, accounting or other advice or as an offer to sell or a solicitation of an offer to buy an interest in any investment product or any other entity sponsored or managed by Shikhara Investment Management. This material doesn’t constitute and should not be considered as any form of financial opinion or recommendation.
This material is prepared by Shikhara Investment Management LP (“Shikhara”). This material does not constitute an offer to sell or the solicitation of an offer to buy in any state of the United States or other U.S. or non-U.S. jurisdiction to any person to whom it is unlawful to make such offer or solicitation in such state or jurisdiction.
Investment involves risk. Past performance is not indicative of future performance. It cannot be guaranteed that the performance of the investment product will generate a return and there may be circumstances where no return is generated. Investors could lose all or a substantial portion of any investment made. Before making any investment decision, investors should read the Prospectus for details and the risk factors. Investors should ensure they fully understand the risks associated with the investment product and should also consider their own investment objective and risk tolerance level. Investors are advised to seek independent professional advice before making any investment.
Shikhara’s investment products are suitable only for sophisticated investors and require the financial ability and willingness to accept the high risks and lack of liquidity inherent in Shikhara’s investment products. Prospective investors must be prepared to bear such risks for an indefinite period of time. No assurance can be given that the investment objectives of any given investment product will be achieved or that investors will receive a return of their investment.
Certain of the information contained in this material are statements of future expectations and other forward-looking statements. Views, opinions and estimates may change without notice and are based on a number of assumptions which may or may not eventuate or prove to be accurate. Actual results, performance or events may differ materially from those in such statements.
Certain information contained in this material is compiled from third-party sources. Whereas Shikhara has, to the best of its endeavor, ensured that such, information is accurate, complete and up-to-date, and has taken care in accurately reproducing the information, Shikhara takes no responsibility for the accidental publication of incorrect information, nor for investment decisions taken based on this material. Neither Shikhara nor any of its affiliates makes any representation or warranty, express or implied, as to the accuracy or completeness of the information contained herein, and nothing contained herein should be relied upon as a promise or representation as to past or future performance of any investment product or any other entity.
The contents of this material are prepared and maintained by Shikhara and has not been reviewed by the Securities and Exchange Commission of the United States.
The Fund managed by Shikhara may or may not hold all of, or some of the securities mentioned in the article.
The Shikhara logo and name are trademarks of Shikhara Investment Management LP, registered in Hong Kong, the People’s Republic of China (PRC), Australia, the United Kingdom, the European Union, and the United States.

This website is published exclusively for the purpose of providing general information about the management services carried out by Shikhara Investment Management LP, Shikhara Capital (Hong Kong) Private Limited and its affiliates (collectively “Shikhara Investment Management” or “Shikhara”). The information presented on the website is not, and may not be relied on in any manner as legal, tax, investment, accounting, or other advice or as an offer to sell or a solicitation of an offer to buy an interest in any investment product or any other entity sponsored or managed by Shikhara Investment Management. This website doesn’t constitute and should not be considered as any form of financial opinion or recommendation.
Shikhara Investment Management LP is a Registered Investment Adviser with the U.S. Securities and Exchange Commission, and Shikhara Capital (Hong Kong) Private Limited is licensed by the Hong Kong Securities and Futures Commission. This website does not constitute an offer to sell or the solicitation of an offer to buy in any state of the United States or other U.S. or non-U.S. jurisdiction to any person to whom it is unlawful to make such offer or solicitation in such state or jurisdiction.
Investment involves risk. Past performance is not indicative of future performance. It cannot be guaranteed that the performance of the investment product will generate a return and there may be circumstances where no return is generated. Investors could lose all or a substantial portion of any investment made. Before making any investment decision, investors should read the Prospectus for details and the risk factors. Investors should ensure they fully understand the risks associated with the investment product and should also consider their own investment objective and risk tolerance level. Investors are advised to seek independent professional advice before making any investment.
Shikhara’s investment products are suitable only for sophisticated investors and require the financial ability and willingness to accept the high risks and lack of liquidity inherent in Shikhara’s investment products. Prospective investors must be prepared to bear such risks for an indefinite period of time. No assurance can be given that the investment objectives of any given investment product will be achieved or that investors will receive a return of their investment.
Certain of the information contained in this website are statements of future expectations and other forward-looking statements. Views, opinions, and estimates may change without notice and are based on a number of assumptions which may or may not eventuate or prove to be accurate. Actual results, performance, or events may differ materially from those in such statements.
Certain information contained in this website is compiled from third-party sources. Whereas Shikhara Investment Management has, to the best of its endeavor, ensured that such information is accurate, complete, and up-to-date, and has taken care in accurately reproducing the information, Shikhara Investment Management takes no responsibility for the accidental publication of incorrect information, nor for investment decisions taken based on this website. Neither Shikhara Investment Management nor any of its affiliates makes any representation or warranty, express or implied, as to the accuracy or completeness of the information contained herein, and nothing contained herein should be relied upon as a promise or representation as to past or future performance of any investment product or any other entity.
The contents of this website are prepared and maintained by Shikhara Investment Management and has not been reviewed by the Securities and Exchange Commission of the United States or the Securities and Futures Commission of Hong Kong.
The Shikhara logo and name are trademarks of Shikhara Investment Management LP, registered in Hong Kong, the People’s Republic of China (PRC), Australia, the United Kingdom, the European Union, and the United States.