
April was a month that rewarded patience. After March’s indiscriminate sell-off, markets snapped back sharply as a ceasefire took hold and fundamentals reasserted themselves. In this month’s commentary, we reflect on why we held our nerve, examine the unprecedented tightness in the AI supply chain and what it means for the enabler-to-adopter rotation, and explore how the US fiscal impulse is quietly powering a global industrial renaissance with Asia as its biggest beneficiary. Geopolitical risks remain, but so does our conviction. Enjoy!
The MSCI All Country Asia Ex-Japan Index rose 16.30% (in USD terms1) in April, rebounding strongly from the sharp March drawdown as the announcement of a US-Iran ceasefire on April 8 restored risk appetite across the region. Relative to the rest of the region, South Korea and Taiwan were the top performers, while Indonesia and the Philippines were the laggards. Sector-wise, IT and Industrials led performance, while Communication Services and Health Care were the worst performing sectors.
MSCI China rose 3.68% in April, a modest recovery after the prior quarter’s geopolitical-driven weakness. The official manufacturing Purchasing Managers’ Index (PMI) edged down to 50.3 (vs 50.4 in March), remaining in expansion territory for the second consecutive month, while the private Caixin PMI surged to 52.2, its highest reading since December 2020, driven by accelerating output and new orders.2 New export orders returned to expansion for the first time in two years, suggesting that the manufacturing sector has so far been largely insulated from the Middle East conflict. However, non-manufacturing PMI fell into contractionary territory at 49.4 (vs 50.1 in March), reflecting softness in services and construction.3 Input cost pressures remain elevated as oil price volatility tied to Middle East disruptions continued to weigh on production costs.
Indian equities rebounded sharply, gaining 9.17% as the combination of ceasefire-driven relief and constructive domestic data supported sentiment. The Manufacturing PMI rose to 54.7 in April (vs 53.9 in March), with new export orders growing at their fastest pace in nine months as global supply chain diversification continued to benefit Indian manufacturers.4 However, the recovery came with inflationary headwinds: input costs rose at the fastest pace in 44 months, driven by higher fuel, oil, and raw material prices linked to Middle East supply disruptions. The Reserve Bank of India (RBI) held the repo rate unchanged at 5.25% at its April meeting, maintaining a neutral stance while flagging upside risks to inflation from elevated crude prices. The RBI revised its FY27 GDP growth forecast down to 6.9% (vs 7.4% in February) and raised its CPI inflation projection to 4.6%.5 Despite the market’s strong rebound, foreign portfolio investors (FPIs) continued to sell, with net outflows of approximately USD 6.5 billion in April, extending a trend that has seen cumulative 2026 outflows reach approximately USD 20 billion.6 Domestic institutional investors remained the key support, absorbing the selling pressure from FPIs.
South Korea was the region’s standout performer, surging 38.23% in April. The rally was driven by a confluence of factors: ceasefire-related risk-on sentiment, record-breaking corporate earnings, and an economy firing on multiple cylinders. South Korea’s Q1 2026 GDP surged 1.7% q/q (3.6% y/y), marking the strongest quarterly growth in five and a half years.7 Exports climbed 5.1% q/q, driven by insatiable global demand for semiconductors and IT products.8 The country’s manufacturing PMI rose to 53.6 in April, the fastest expansion in over four years.9
Similarly, in Taiwan, equities gained 26.22%, driven by continued strength in the AI semiconductor supply chain. Taiwan’s Q1 2026 GDP surged 13.7% y/y, the fastest pace of growth since 1987, beating the 11.3% consensus by a wide margin.10 The expansion was powered by exports of goods and services, which soared 35.25% y/y as global demand for AI-related technologies drove record orders for semiconductors and high-end components.11 Domestic demand also strengthened meaningfully, with household consumption rising 4.89% (vs 3.45% in Q4 2025) and facility investment surging on expanded adoption of AI and advanced manufacturing equipment.12
Within ASEAN, performance remains diverged. Thailand and Malaysia led the region on the back of ceasefire-driven sentiment improvement. Indonesia was the region’s worst performer for the fifth consecutive month, as the hangover from MSCI’s earlier downgrade warning continued to weigh on sentiment. Meanwhile, Vietnam stood out positively after FTSE Russell confirmed its upgrade to emerging market status effective September 2026. The announcement triggered a strong rally in the VN-Index, which posted solid gains for the month amid expectations of strong passive inflows in the coming quarters.
In our Q1 commentary, we wrote that the March drawdown was a temporary dislocation and that Asian equities presented one of the most compelling entry points in years. April validated that view decisively. The MSCI AC Asia Ex-Japan Index rallied 16.30%, with Korea and Taiwan recovering the entirety of their March losses and then some. Our decision not to sell during the March panic was grounded in a simple framework: as long as China did not intervene militarily in the Middle East conflict, the fundamental investment case for Asia remained intact. That assessment proved correct. What followed was a textbook reversal of the “baby with the bathwater” selling that had indiscriminately penalized the region.
The Strait of Hormuz, while not fully reopened, saw partial traffic resume in April, and the US paused its naval blockade, citing progress in negotiations. Markets responded swiftly, with risk appetite returning across the region and oil pulling back from its highs. However, the ceasefire has been fragile, with violations on both sides, and the core issues of Iran’s nuclear program, sanctions relief, and Hormuz sovereignty remain unresolved.
As of this writing on May 8th, the two sides are reportedly close to agreeing on a 14-point memorandum of understanding that would formally end hostilities and initiate a 30-day period of detailed negotiations. Markets appear to be pricing in a resolution, and we share that base case, but we are watching closely. Oil remains around USD 120 per barrel, and we are hearing increasing pain from businesses, particularly in global aviation and logistics. Should the conflict drag on for another two to three weeks without a formal framework, the risk of a further oil spike and broader economic damage rises materially. At that point, the impact on corporate earnings would extend beyond a single quarter.
The AI supply chain has entered a phase of acute tightness that we have not seen since the early days of the semiconductor cycle in 2017-18. GPU shortages are widespread, memory prices continue to spike, and virtually every component in the AI infrastructure stack, from optical transceivers to advanced packaging capacity, is in short supply. The stocks of companies operating in these segments have responded accordingly, with Samsung, SK Hynix, TSMC, and the broader AI hardware ecosystem rallying sharply.
What is fueling this squeeze is a step-change in real-world AI demand. The era of token-based consumption has arrived far faster than most anticipated. Companies like Anthropic, whose annualized revenue surged from approximately USD 9 billion at the end of 2025 to ~USD 30 billion by March 2026, are emblematic of the explosive growth in AI inference demand.13 Anthropic CEO, Dario Amodei, recently disclosed that usage grew 80-fold in Q1 on an annualized basis, far exceeding the company’s own planning for 10x growth.14 This is not hype; it is infrastructure struggling to keep pace with real usage. AI platforms have begun rationing access and restricting third-party tool integrations to manage capacity, further validating that demand is running ahead of supply.
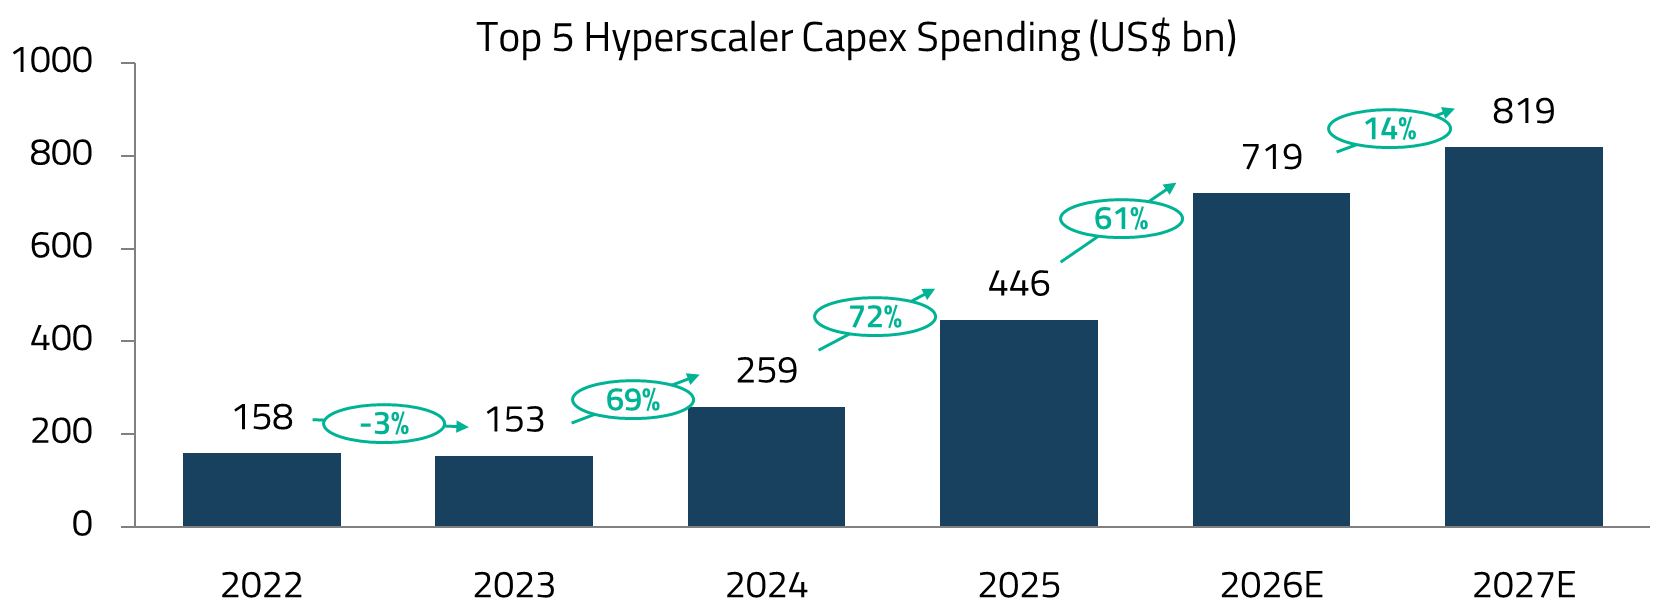
We had anticipated that the market narrative would begin to rotate from AI enablers to AI adopters in 2026, but given supply tightness, that rotation is more likely to play out towards the end of the year. While the earnings momentum behind enabler names remains strong in the near term, we expect growth to normalize in the coming quarters. The current environment is one where AI capex is being spent with virtually no constraints: the Trump administration has rolled back regulatory oversight, the One Big Beautiful Bill Act’s (OBBBA) pro-investment incentives are amplifying the spending impulse, and hyperscaler management teams are racing to secure capacity. But markets are forward-looking, and that unconstrained spending will eventually face a reality check.
We expect the 2026 midterms to be a catalyst, as Democrats will almost certainly question why hundreds of billions are being directed toward AI infrastructure while other priorities go unaddressed. As the rate of capex growth decelerates off a high base, the market will begin to reward the companies that are actually converting AI into measurable gains in productivity, engagement, and margins, rather than those simply supplying the picks and shovels.
Running in parallel to the AI story is a US fiscal impulse that is providing a powerful tailwind to global industrials. President Trump’s OBBBA, signed into law in July 2025, permanently extended the 2017 individual tax cuts, restored 100% immediate expensing for business investment, and included significant defense and infrastructure spending. That fiscal stimulus is now flowing through to the real economy. The US ISM Manufacturing PMI held at 52.7 in April, its highest level since August 2022 and the fourth consecutive month of expansion, with new orders accelerating.15 Four of the six largest US manufacturing industries, including Machinery, Computer & Electronic Products, and Transportation Equipment, reported expansion. This is not unrelated to the AI boom: much of the infrastructure buildout, from data center construction to power grid upgrades to factory automation, sits at the intersection of AI investment and traditional industrials. The OBBBA’s pro-investment incentives are effectively turbocharging a capex cycle that was already accelerating.
In Asia, the region’s semiconductor fabs, electronic component makers, precision machinery exporters, and industrial equipment manufacturers are all leveraged to the same capex cycle, and that linkage is showing up clearly in the data. Manufacturing PMIs across South Korea, Japan, India, and China all surged in April, in several cases hitting multi-year highs. Industrials as a sector has been a standout performer across the region, and management commentary from Asian industrial companies has been notably constructive, reinforcing our conviction in this part of the market.
To be clear, we are merely highlighting the US fiscal tailwind and not necessarily making a case for US equities. The OBBBA may be stimulating demand, but it comes at a cost: the bill is projected to add over USD 3 trillion to the federal deficit over the next decade, at a time when the US is already running historically elevated fiscal deficits.16 Domestically, affordability pressures are building, and the Middle East conflict has only exacerbated this. The ISM’s manufacturing prices index surged to 84.6 in April, its highest since April 2022, driven by rising energy and raw material costs.17 Consumers and businesses are feeling the squeeze, and a significant amount of optimism is already priced into US equity valuations.
Asian equities, by contrast, offer a more compelling risk-reward. The region’s manufacturers and technology companies are direct beneficiaries of the same US spending impulse, but trade at substantially lower multiples. Corporate earnings momentum across Korea, Taiwan, and India is accelerating, underpinned by structural drivers, from AI supply chain dominance to manufacturing diversification, that extend well beyond any single piece of US legislation. And unlike the US, where fiscal expansion is adding leverage to an already stretched balance sheet, many Asian economies are entering this cycle with healthier fiscal positions, rising domestic consumption, and policy frameworks that are actively courting capital back to home markets.
As outlined above, the macro backdrop is constructive, but we are mindful of the risks. The disruption in the Strait of Hormuz has extended beyond comfort; oil inventories are low, and while we are not yet seeing large-scale shutdowns, the margin for error narrows with each passing week. The outcome ultimately rests in the hands of a small number of policymakers who have shown little predictability in their decision-making. We are watching this closely and will adjust positioning if the situation deteriorates, but all signs indicate a positive resolution for now.
The portfolio has been resilient considering the benchmark’s technology weighting of approximately 37% versus our exposure of roughly 25% to the sector. That performance is a reflection of our bottom-up stock selection. Whether it is TSMC, Samsung, Delta, or MediaTek, each of these holdings represents a best-in-class franchise with durable competitive advantages, pricing power, and direct exposure to the AI infrastructure buildout.
Samsung, TSMC, and Delta remain core holdings at maintained weights. We modestly increased our exposure to MediaTek, a position we have held for two years. MediaTek had traded sideways for much of the past 6-9 months, but recent developments saw the company gain meaningful share in custom ASIC design wins for Google and Amazon’s TPU programs, positioning it as a beneficiary of the diversification away from pure Nvidia reliance. We also initiated a position in Zhongji Innolight, a leading Chinese optical transceiver manufacturer that is directly benefiting from the surge in data center interconnect demand. As AI clusters grow in scale, the bandwidth requirements for intra-datacenter and inter-datacenter communication are rising exponentially, and optical networking is a critical bottleneck.
On industrials, while we remain constructive on the cycle, we are not aggressively ramping up cyclical exposure and are comfortable with our current positioning. Our industrial exposure remains anchored in Korean power infrastructure, shipbuilding, and defense names, where order books stretch into the late 2020s and the structural drivers, from US and European grid modernization to global defense procurement, extend well beyond any single quarter of economic data.
Overall, our conviction in holding through the March drawdown, rather than de-risking into the sell-off, has been a significant driver of April’s strong performance. The discipline to stay invested when the market is offering quality businesses at distressed prices is, we believe, one of the most important edges in active management.
For sophisticated investors only. For informational purposes only. The information presented in the material is not, and may not be relied on in any manner as legal, tax, investment, accounting or other advice or as an offer to sell or a solicitation of an offer to buy an interest in any investment product or any other entity sponsored or managed by Shikhara Investment Management. This material doesn’t constitute and should not be considered as any form of financial opinion or recommendation.
This material is prepared by Shikhara Investment Management LP (“Shikhara”). This material does not constitute an offer to sell or the solicitation of an offer to buy in any state of the United States or other U.S. or non-U.S. jurisdiction to any person to whom it is unlawful to make such offer or solicitation in such state or jurisdiction.
Investment involves risk. Past performance is not indicative of future performance. It cannot be guaranteed that the performance of the investment product will generate a return, and there may be circumstances where no return is generated. Investors could lose all or a substantial portion of any investment made. Before making any investment decision, investors should read the Private Placement Memorandum for details and the risk factors. Investors should ensure they fully understand the risks associated with the investment product and should also consider their own investment objective and risk tolerance level. Investors are advised to seek independent professional advice before making any investment.
Shikhara’s investment products are suitable only for sophisticated investors and require the financial ability and willingness to accept the high risks and lack of liquidity inherent in Shikhara’s investment products. Prospective investors must be prepared to bear such risks for an indefinite period of time. No assurance can be given that the investment objectives of any given investment product will be achieved or that investors will receive a return of their investment.
Certain of the information contained in this material are statements of future expectations and other forward-looking statements. Views, opinions, and estimates may change without notice and are based on a number of assumptions which may or may not eventuate or prove to be accurate. Actual results, performance or events may differ materially from those in such statements.
Certain information contained in this material is compiled from third-party sources. The information and any opinions contained in this document have been obtained from sources that Shikhara considers reliable, but Shikhara does not represent that such information and opinions are accurate or complete, and thus should not be relied upon as such. Furthermore, all opinions are current only as of the date of distribution and are subject to change without notice. Shikhara does not have any obligation to provide revised opinions in the event of changed circumstances. Whereas Shikhara has, to the best of its endeavor, ensured that such information is accurate, complete, and up-to-date, and has taken care in accurately reproducing the information, Shikhara takes no responsibility for the accidental publication of incorrect information, nor for investment decisions taken based on this material. Neither Shikhara nor any of its affiliates makes any representation or warranty, express or implied, as to the accuracy or completeness of the information contained herein, and nothing contained herein should be relied upon as a promise or representation as to past or future performance of any investment product or any other entity.
The MSCI AC Asia ex Japan Index captures large and mid-cap representation across Developed Markets (DM) countries (excluding Japan) and Emerging Markets (EM) countries in Asia. The index covers approximately 85% of the free float-adjusted market capitalization in each country. The MSCI China Index captures large and mid-cap representation across China A shares, H shares, B shares, Red chips, P chips, and foreign listings (e.g. ADRs). The index covers about 85% of the Chinese equity universe.
The contents of this material are prepared and maintained by Shikhara and have not been reviewed by the Securities and Exchange Commission of the United States.
The Shikhara logo and name are trademarks of Shikhara Investment Management LP, registered in Hong Kong, the People’s Republic of China (PRC), Australia, the United Kingdom, the European Union, and the United States.
This website is published exclusively for the purpose of providing general information about the management services carried out by Shikhara Investment Management LP, Shikhara Capital (Hong Kong) Private Limited and its affiliates (collectively “Shikhara Investment Management” or “Shikhara”). The information presented on the website is not, and may not be relied on in any manner as legal, tax, investment, accounting, or other advice or as an offer to sell or a solicitation of an offer to buy an interest in any investment product or any other entity sponsored or managed by Shikhara Investment Management. This website doesn’t constitute and should not be considered as any form of financial opinion or recommendation.
Shikhara Investment Management LP is currently an Exempt Reporting Adviser that is exempt from registration as an investment adviser with the U.S. Securities and Exchange Commission and Shikhara Capital (Hong Kong) Private Limited has been approved by the Hong Kong Securities and Futures Commission. This website does not constitute an offer to sell or the solicitation of an offer to buy in any state of the United States or other U.S. or non-U.S. jurisdiction to any person to whom it is unlawful to make such offer or solicitation in such state or jurisdiction.
Investment involves risk. Past performance is not indicative of future performance. It cannot be guaranteed that the performance of the investment product will generate a return and there may be circumstances where no return is generated. Investors could lose all or a substantial portion of any investment made. Before making any investment decision, investors should read the Prospectus for details and the risk factors. Investors should ensure they fully understand the risks associated with the investment product and should also consider their own investment objective and risk tolerance level. Investors are advised to seek independent professional advice before making any investment.
Shikhara’s investment products are suitable only for sophisticated investors and require the financial ability and willingness to accept the high risks and lack of liquidity inherent in Shikhara’s investment products. Prospective investors must be prepared to bear such risks for an indefinite period of time. No assurance can be given that the investment objectives of any given investment product will be achieved or that investors will receive a return of their investment.
Certain of the information contained in this website are statements of future expectations and other forward-looking statements. Views, opinions, and estimates may change without notice and are based on a number of assumptions which may or may not eventuate or prove to be accurate. Actual results, performance, or events may differ materially from those in such statements.
Certain information contained in this website is compiled from third-party sources. Whereas Shikhara Investment Management has, to the best of its endeavor, ensured that such information is accurate, complete, and up-to-date, and has taken care in accurately reproducing the information, Shikhara Investment Management takes no responsibility for the accidental publication of incorrect information, nor for investment decisions taken based on this website. Neither Shikhara Investment Management nor any of its affiliates makes any representation or warranty, express or implied, as to the accuracy or completeness of the information contained herein, and nothing contained herein should be relied upon as a promise or representation as to past or future performance of any investment product or any other entity.
The contents of this website are prepared and maintained by Shikhara Investment Management and has not been reviewed by the Securities and Exchange Commission of the United States or the Securities and Futures Commission of Hong Kong.
The Shikhara logo and name are trademarks of Shikhara Investment Management LP, registered in Hong Kong, the People’s Republic of China (PRC), Australia, the United Kingdom, the European Union, and the United States.