


Every so often, the market rewards a single idea so completely that it drowns out everything else. The first half of 2026 was such a moment, as a handful of AI names carried Asia while much of the region was left behind. History suggests these narrow markets rarely stay narrow for long. In this edition, we review a remarkable half-year, reflect candidly on our own performance, and explain why we believe the months ahead will reward patience, quality, and the discipline to look beyond the crowd.
The MSCI All Country Asia Ex-Japan Index rose 27.78% (in USD terms1) over Q2 2026, driven by a rebound from the March US-Iran sell-off after ceasefire discussions revived risk appetite, followed by an increasingly narrow, AI-led rally in North Asia’s semiconductor complex. South Korea and Taiwan were the region’s top performers, while Indonesia and China were the laggards. By sector, IT and Industrials led, while Consumer Discretionary and Energy were the worst performers. The index gave back a modest 1.25% in June as the North Asian markets that had led the rally stalled and no new leadership emerged.
MSCI China declined 6.81% in Q2, as the AI-led rally bypassed offshore Chinese equities. A modest April recovery gave way to declines in May (-3.03%) and a sharper drop in June (-7.30%), driven by a widening onshore-offshore split: onshore benchmarks reached multi-year highs, with the CSI 300 at its highest since December 2021, while offshore Chinese shares slid as mainland liquidity favored domestic technology and AI plays. The real economy held firmer than equities. The official manufacturing Purchasing Managers Index (PMI) edged up to 50.3 in June (vs 50.0 in May), a third straight month of expansion, with high-tech equipment manufacturing at 53.5 on AI-linked export demand, even as consumer goods and construction lagged.2 Input-cost pressures eased as oil retreated, and full-year 2025 GDP met Beijing’s 5.0% target.
Indian equities were among the region’s more resilient performers in Q2, up 10.20%, rising 9.17% in April, broadly flat in May (-0.58%), and up 1.53% in June. June’s modest gain masked a sharp rotation, with banking and financial stocks leading while IT was the main laggard on weak global tech-spend signals and a higher-for-longer US rate view. Retail inflation rose to 3.93% in May, a fifth straight increase and the highest in the new CPI series, led by food inflation of 4.78%.3 Provisional FY26 GDP growth was near 7.6%, the strongest since FY22.4 Despite the economic growth, foreign investors stayed net sellers while domestic institutions absorbed the pressure, and the rupee held near record lows around 95 per dollar.
South Korea was the region’s standout, surging 87.62% over the quarter, rallying in April (+38.23%) and May (+35.29%), before stalling in June (+0.33%). June was volatile: after fresh record highs early in the month, the KOSPI suffered a sharp mid-month correction as Samsung Electronics and SK Hynix led a chip-driven sell-off, then recovered to close broadly flat. Fundamentals remained strong, with June exports surpassing USD 100 billion for the first time on record, following first-quarter GDP revised up to 1.8% q/q, the fastest in five and a half years.56 The rally stayed highly concentrated, with Samsung and SK Hynix together at a record share of the index, and analysts increasingly flagged a “one-legged” export economy as sectors outside chips continued to struggle.
Taiwanese equities gained 48.95% in Q2, surging in April (+26.22%) and May (+16.53%), followed by a more measured return in June (1.27%). The TAIEX surpassed 47,000 for the first time in late June on AI optimism and progress in US-Iran talks, then pulled back as traders locked in gains. Macro momentum was extraordinary: the statistics agency in late May upgraded its full-year 2026 GDP growth forecast to 9.64%, a 16-year high, after first-quarter growth of roughly 14% powered almost entirely by chip exports.7 As in Korea, leadership narrowed to an extreme, with TSMC alone accounting for more than 40% of the TAIEX and over 60% of the MSCI Taiwan Index.
Within ASEAN, performance diverged sharply. Singapore rose 2.92% in June, bringing Q2 returns to 10.31% and cementing its safe-haven role. The Straits Times Index reached record highs early in June, supported by first-quarter GDP revised up to 6%, a record current-account surplus, and an upgraded 2026 non-oil domestic exports forecast of 3.0% to 5.0%.8 The Philippines was June’s strongest market, up 8.24% (+4.72% for Q2), as investors rotated into one of Southeast Asia’s cheapest markets, aided by easing crude, even as the central bank raised its policy rate 25bp to 4.75%.9 Indonesia was again the region’s worst performer, down 25.72% in Q2, including 8.50% in June, as a mid-June sell-off wiped out an estimated USD 80 billion ahead of MSCI’s downgrade verdict. On June 24, MSCI deferred its decision on reclassifying Indonesia to frontier status until November, sparking a brief relief rally, but the rupiah held near record lows and outflows continued amid concerns over President Prabowo’s fiscal stance and expanding state role. Vietnam continued to stand out, with growth forecast near 8.5% for 2026 and FTSE Russell’s emerging-market upgrade taking effect in September.
The first half of 2026 has rewarded an exceptionally narrow set of winners, and the debates within our team have been fierce, above all between technology and everything else. When a market like Korea can fall 10% in a single session, the instinct is to fear being late, and that fear has kept many investors from committing to Asia at all. This is where our approach differs. We regard a period of consolidation in the leaders as healthy, and we would welcome it, because it is precisely what allows leadership to broaden into the parts of the market we find most compelling. What follows sets out the main questions we have been wrestling with and where we have come out.
Share prices for the technology leaders corrected over recent weeks, but the underlying demand momentum and the current supply shortages are unchanged. What shifted was ownership. The space had become over-owned, with a heavy presence of retail (especially leveraged retail investors), and after such a run a pullback was warranted. It is worth being clear that this was a correction in positioning rather than a deterioration in fundamentals. We continue to hold roughly one third of the portfolio in technology, concentrated in high-quality operators and select memory, and our conviction rests on quality and genuine technological expertise held for the long term, not on chasing momentum.
The central debate on our team has been whether the warning signs from flows now outweigh the still-positive fundamentals. On one side sit extreme hedge fund concentration in semiconductors, overleveraged retail investors in Korea and Taiwan, forced margin liquidations and circuit breakers. On the other sits a fundamental backdrop that remains strong, with memory price increases running at 40% to 50% QoQ against street expectations of 10% to 15%, and demand still comfortably outstripping supply.10 One camp drew an analogy to the 2007 infrastructure cycle, where prices that stall despite good news often signal a top. The other countered that prices were still responding to positive surprises, which suggests the inflection has not yet arrived.
On balance we side with the fundamentals, though when stocks fall even on strong results, as we saw with Samsung, it tells us positioning and sentiment are doing more work than earnings. The flow signals are real and warrant respect, so we express this through stock selection rather than a top-down bet, holding technology in only the strongest names and treating the concentration and leverage indicators as our primary warning system into the July earnings season. That is the moment we expect to tell us whether the cycle is extending or turning.
The more important question for the second half is how quickly adoption follows the enormous investment now committed to AI, and here we would counsel patience. A telling signal has emerged in recent weeks: the largest builders of AI infrastructure have themselves begun looking to monetize surplus capacity. Meta, after a buildout that could take its 2026 capital expenditure (capex) toward the region of USD 125 to 145 billion, is now exploring a business to sell its excess computing capacity to third parties.11 This echoes a similar pattern at xAI and SpaceX, which have been leasing out capacity from their Colossus facility through large, multi-year compute agreements. While these decisions are strategically rational, the signal worth watching is not the headline itself but what the hyperscalers guide to on capex this earnings season, which we are monitoring closely.
The industry’s own leaders increasingly acknowledge the tension. Bill Gates has warned of a frenzy in data-center spending and cautioned that not every facility will earn its return, whether because power proves too expensive, because rapid chip obsolescence erodes value before payback, or because operators have simply overcommitted; he has also argued that ordinary households should not end up subsidizing higher electricity costs for these projects. Satya Nadella, for his part, has emphasized that enterprises will increasingly want to run AI on private or sovereign infrastructure and to build their own learning loops on proprietary data, rather than route their most valuable information through large external models and risk eroding their competitive edge.
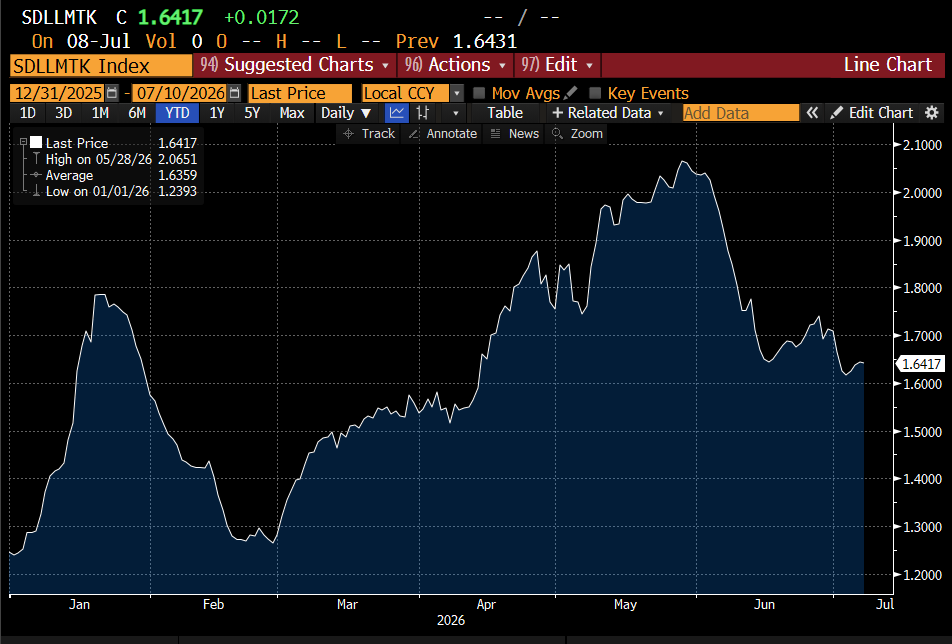
The implication, and our own working conclusion, is that enterprise adoption of AI is real and coming, but adoption of the largest, general-purpose (frontier) models will likely prove slower as companies work out how to capture the benefits without surrendering their competitive advantage through data leakage or commoditization of proprietary knowledge. Consistent with this, the widely tracked Silicon Data LLM Token Expenditure Index (a key gauge of actual AI token usage and spending) has already rolled over, falling over 20% from its May 2026 peak (after nearly doubling since its December 2025 inception).12 This reflects shifts toward cheaper open-source/open-weight models for many workloads, feeding concerns that near-term revenues and monetization are not yet keeping pace with the capex spends.
Our reading is that adoption will come, but that corporates will need several quarters to settle on the right approach. That is where recent upgrades to technology earnings expectations could give way to downgrades, and it is why we remain selective, holding the strongest enablers while taking profits where optimism has outrun what the fundamentals can support.
Over recent weeks, parts of the market beyond technology have started to attract a bid. Many of these names were hit from March onward with the onset of the Middle East crisis, but as the conflict moves toward resolution, the businesses that had underperformed most are beginning to recover. The result is a more balanced rally, which we welcome, and we expect the second half to be defined by technology taking a breather while high-quality, non-technology franchises with strong competitive positions catch up. The pattern is visible at the country level. In Korea, the first half was almost entirely about semiconductors, while other industries such as cosmetics manufacturing, defense and shipbuilding were left behind. As value rotates out of semis, these should do better.
China is where this rotation could matter most. We have grown more confident on the leading Chinese internet and cloud platforms, and our conviction rests on a straightforward observation: their models are genuinely competitive, yet the shares continue to be sold because the AI infrastructure names have absorbed the available capital, leaving the platforms starved. As leadership broadens and their earnings improve from here, we expect capital to return to them. Additionally, with positioning at record lows and base effects in Chinese retail sales set to turn favorable from August and September onwards, we regard them as one of our better-placed opportunities into the second half. We do not expect policymakers to feel any urgency to add fresh stimulus in the meantime.
One question we are keeping open is the claim from several Chinese developers that a small fraction of the spending can match frontier-model output. Our instinct is skeptical, since resources and output tend to track one another, but we recognize the counterargument that cheaper models diffuse naturally over time, and this is a debate we would rather monitor as the evidence comes in than resolve prematurely, as it bears directly on how much of the value accrues to the platforms.
In Chinese consumption more broadly, we are wary of confusing deep value with a value trap. For example, some appliance names offer high-single-digit dividend yields but carry legitimate questions about capital allocation and stagnant margins in acquired businesses. Our preference is for cleaner, pure-play names, which we also judge would benefit more from any eventual stimulus.
India tells a similar story at the market level. It has been one of the region’s notable underperformers year-to-date, held back by persistent foreign selling and a soft currency even as domestic growth held up. We regard that underperformance as an opportunity rather than a warning. There are nuanced pockets of value we continue to like, particularly among manufacturing exporters and healthcare franchises, and we expect them to take part in the broadening of leadership over the second half.
This dynamic is already visible within our own portfolio. Over the past six months, our AI-enabler holdings, which averaged around a quarter of the book, returned over 75%, while the remainder of the portfolio was modestly negative. Our returns over the period were, in effect, driven entirely by the AI enablers, with the larger, non-technology part of the book yet to contribute. This tells us two things: 1) our AI enabler stock selection has performed exceptionally well, and 2) with the rest of the portfolio still to participate, there is substantial embedded upside as leadership broadens. We have not sacrificed quality to chase momentum, which is why our technology weight sits below the benchmark. While that has held back relative performance this year, it also means that in a meaningful technology correction, on the order of 20% to 30%, the portfolio should prove more resilient than the index, given both its lighter weighting and the quality of what we own in tech.
The opportunity rests on more than a rebound in sentiment. The non-technology part of the portfolio is expected to grow earnings by roughly 47% in FY26 and 23% in FY27. Many of these names have actually become cheaper as market attention has been so focused on the AI momentum. With certain internet and healthcare sector names having de-rated 20-35% over the last 6 months, a re-rating back to historical multiples, on top of the expected earnings growth, could lead to a powerful catch-up dynamic. As the market rotates from tech to other sectors, this part of the portfolio represents meaningful dry powder.
Much of this broadening opportunity sits in the consumer and internet names that the AI trade has left behind, spanning Korean beauty, the Chinese platforms, and India’s consumption leaders. We lay out the detailed, name-by-name case in our recent Asia Consumption paper, which argues that these high-quality franchises are trading at crisis prices even as their earnings continue to compound.
The portfolio enters the second half positioned for exactly the rotation described above: we retain the strongest AI enablers in North Asia while broadening into high-quality adopters and non-technology franchises. The overall shape reflects this. Information technology remains our largest sector, held in a concentrated set of quality names; we carry meaningful weights in industrials, consumer discretionary and healthcare. From a market perspective:
South Korea, our largest country position at roughly a quarter of the fund. Korea sits at the intersection of the two themes we have backed longest: the AI memory cycle and the reindustrialization of heavy industry. In semis, we hold the memory leaders Samsung Electronics and SK Hynix, alongside exposure to semiconductor equipment, where the scope for margin expansion is not yet reflected in the price. Reindustrialization is expressed through Hanwha Aerospace and HD Hyundai Heavy Industries, whose order books extend well into the late 2020s. Our long-standing power-infrastructure theme runs through the state utility KEPCO and grid-equipment names geared to a multi-year upgrade of power networks. We round out the book with a position in K-beauty contract manufacturing and a small auto holding.
China and Hong Kong, together making up roughly a quarter of the fund and the market where we have been adding most actively. This is where our adopter thesis is most directly expressed. We own the major consumer-internet platforms (Tencent, Alibaba, PDD, and Baidu), which we believe are being sold too cheaply even as they integrate AI into their businesses. We pair these with supply-chain leaders in the energy transition, including the battery maker CATL and dominant solar-inverter and optical-transceiver franchises in the AI hardware chain. Healthcare innovation and a gold-and-copper mining position provide diversification. Consistent with our “last man standing” discipline, our internet exposure is concentrated in the scaled platforms rather than in loss-making players in subsidy-driven categories. Our financials exposure sits here too, concentrated in two Asia-geared cross-border franchises rather than domestic lenders: Standard Chartered, whose wealth-management business across Hong Kong, Singapore and the UAE continues to compound, and Prudential, the pan-Asian life insurer.
Our Taiwan exposure is deliberately concentrated in the highest-quality AI enablers. TSMC is the single-largest position in the fund, reflecting our view that its constraint has been supply rather than pricing. Alongside it we hold MediaTek, a diversified fabless leader expanding into custom data-center silicon, and Alchip, a pure-play design house, both of which should gain share as hyperscalers direct more spending toward their own chips. We also hold Delta Electronics, a power-and-thermal supplier that AI centers demand, regardless of which chips ultimately prevail. Having taken some profits after a strong run, we keep the enablers where the earnings backdrop remains firm, while remaining mindful of the concentration this theme carries.
Our India book is tilted toward domestic healthcare, consumption, and precision-manufacturing exporters rather than the large-cap financials that dominate the market. In hospitals, we own Narayana Hrudayalaya and Apollo Hospitals, both benefiting from rising healthcare demand and disciplined expansion. We hold exposure to luxury hospitality and travel, while our exporter and manufacturing positions run through precision-component and specialty-plastics names geared to global supply chains. In consumer internet, we hold a small position in the food-delivery and quick-commerce category, focused on the disciplined, better-capitalized operator. This tilt toward exporters and defensives reflects the medium-term caution on India’s hiring cycle set out above.
In ASEAN, we have a small but deliberate allocation spread across Singapore, Malaysia, and Vietnam. Sea Limited and Grab, two digital platforms with strengthening profitability and widening moats, are clear examples of the AI adopters we continue to favor. In Malaysia, we own the regional hospital operator IHH Healthcare, which continues to benefit from the recovery in medical tourism and disciplined regional expansion. In Vietnam, our position in the leading electronics and grocery retailer Mobile World Investment is our expression of the structural growth story, supported by an acceleration in public investment, reform momentum, and FTSE Russell’s emerging-market upgrade taking effect in September.
Overall, we enter the second half optimistically. The conditions that defined the first half, a historically narrow market led by a handful of AI names, are precisely the conditions we expect to give way as leadership broadens and the high-quality franchises we own begin to participate. Our philosophy has not changed, and it is what carries us through periods like this: we buy great businesses run by capable stewards, we insist on quality and valuation discipline rather than chasing momentum, and we are content to be patient where conviction is high, knowing that our best outcomes have tended to compound over years rather than quarters. We treat the benchmark as a reference rather than a constraint, and we would rather hold the right businesses through a period that tests our patience than own the wrong ones for the comfort of keeping pace.
For sophisticated investors only. For informational purposes only. The information presented in the material is not, and may not be relied on in any manner as legal, tax, investment, accounting or other advice or as an offer to sell or a solicitation of an offer to buy an interest in any investment product or any other entity sponsored or managed by Shikhara Investment Management. This material doesn’t constitute and should not be considered as any form of financial opinion or recommendation.
This material is prepared by Shikhara Investment Management LP (“Shikhara”). This material does not constitute an offer to sell or the solicitation of an offer to buy in any state of the United States or other U.S. or non-U.S. jurisdiction to any person to whom it is unlawful to make such offer or solicitation in such state or jurisdiction.
Investment involves risk. Past performance is not indicative of future performance. It cannot be guaranteed that the performance of the investment product will generate a return, and there may be circumstances where no return is generated. Investors could lose all or a substantial portion of any investment made. Before making any investment decision, investors should read the Private Placement Memorandum for details and the risk factors. Investors should ensure they fully understand the risks associated with the investment product and should also consider their own investment objective and risk tolerance level. Investors are advised to seek independent professional advice before making any investment.
Shikhara’s investment products are suitable only for sophisticated investors and require the financial ability and willingness to accept the high risks and lack of liquidity inherent in Shikhara’s investment products. Prospective investors must be prepared to bear such risks for an indefinite period of time. No assurance can be given that the investment objectives of any given investment product will be achieved or that investors will receive a return of their investment.
Certain of the information contained in this material are statements of future expectations and other forward-looking statements. Views, opinions, and estimates may change without notice and are based on a number of assumptions which may or may not eventuate or prove to be accurate. Actual results, performance or events may differ materially from those in such statements.
Certain information contained in this material is compiled from third-party sources. The information and any opinions contained in this document have been obtained from sources that Shikhara considers reliable, but Shikhara does not represent that such information and opinions are accurate or complete, and thus should not be relied upon as such. Furthermore, all opinions are current only as of the date of distribution and are subject to change without notice. Shikhara does not have any obligation to provide revised opinions in the event of changed circumstances. Whereas Shikhara has, to the best of its endeavor, ensured that such information is accurate, complete, and up-to-date, and has taken care in accurately reproducing the information, Shikhara takes no responsibility for the accidental publication of incorrect information, nor for investment decisions taken based on this material. Neither Shikhara nor any of its affiliates makes any representation or warranty, express or implied, as to the accuracy or completeness of the information contained herein, and nothing contained herein should be relied upon as a promise or representation as to past or future performance of any investment product or any other entity.
The MSCI AC Asia ex Japan Index captures large and mid-cap representation across Developed Markets (DM) countries (excluding Japan) and Emerging Markets (EM) countries in Asia. The index covers approximately 85% of the free float-adjusted market capitalization in each country. The MSCI China Index captures large and mid-cap representation across China A shares, H shares, B shares, Red chips, P chips, and foreign listings (e.g. ADRs). The index covers about 85% of the Chinese equity universe.
The contents of this material are prepared and maintained by Shikhara and have not been reviewed by the Securities and Exchange Commission of the United States.
The Shikhara logo and name are trademarks of Shikhara Investment Management LP, registered in Hong Kong, the People’s Republic of China (PRC), Australia, the United Kingdom, the European Union, and the United States.

This website is published exclusively for the purpose of providing general information about the management services carried out by Shikhara Investment Management LP, Shikhara Capital (Hong Kong) Private Limited and its affiliates (collectively “Shikhara Investment Management” or “Shikhara”). The information presented on the website is not, and may not be relied on in any manner as legal, tax, investment, accounting, or other advice or as an offer to sell or a solicitation of an offer to buy an interest in any investment product or any other entity sponsored or managed by Shikhara Investment Management. This website doesn’t constitute and should not be considered as any form of financial opinion or recommendation.
Shikhara Investment Management LP is a Registered Investment Adviser with the U.S. Securities and Exchange Commission, and Shikhara Capital (Hong Kong) Private Limited is licensed by the Hong Kong Securities and Futures Commission. This website does not constitute an offer to sell or the solicitation of an offer to buy in any state of the United States or other U.S. or non-U.S. jurisdiction to any person to whom it is unlawful to make such offer or solicitation in such state or jurisdiction.
Investment involves risk. Past performance is not indicative of future performance. It cannot be guaranteed that the performance of the investment product will generate a return and there may be circumstances where no return is generated. Investors could lose all or a substantial portion of any investment made. Before making any investment decision, investors should read the Prospectus for details and the risk factors. Investors should ensure they fully understand the risks associated with the investment product and should also consider their own investment objective and risk tolerance level. Investors are advised to seek independent professional advice before making any investment.
Shikhara’s investment products are suitable only for sophisticated investors and require the financial ability and willingness to accept the high risks and lack of liquidity inherent in Shikhara’s investment products. Prospective investors must be prepared to bear such risks for an indefinite period of time. No assurance can be given that the investment objectives of any given investment product will be achieved or that investors will receive a return of their investment.
Certain of the information contained in this website are statements of future expectations and other forward-looking statements. Views, opinions, and estimates may change without notice and are based on a number of assumptions which may or may not eventuate or prove to be accurate. Actual results, performance, or events may differ materially from those in such statements.
Certain information contained in this website is compiled from third-party sources. Whereas Shikhara Investment Management has, to the best of its endeavor, ensured that such information is accurate, complete, and up-to-date, and has taken care in accurately reproducing the information, Shikhara Investment Management takes no responsibility for the accidental publication of incorrect information, nor for investment decisions taken based on this website. Neither Shikhara Investment Management nor any of its affiliates makes any representation or warranty, express or implied, as to the accuracy or completeness of the information contained herein, and nothing contained herein should be relied upon as a promise or representation as to past or future performance of any investment product or any other entity.
The contents of this website are prepared and maintained by Shikhara Investment Management and has not been reviewed by the Securities and Exchange Commission of the United States or the Securities and Futures Commission of Hong Kong.
The Shikhara logo and name are trademarks of Shikhara Investment Management LP, registered in Hong Kong, the People’s Republic of China (PRC), Australia, the United Kingdom, the European Union, and the United States.