
The first quarter of 2026 began with optimism, anchored by trade deals, a growth-oriented Budget, and easing inflation, only to be derailed by the escalation of conflict in the Middle East and the sharpest monthly foreign outflow on record. Yet beneath the noise, the structural case for India has arguably never been stronger. In this edition, we explain why we view the March dislocation as an opportunity rather than a warning and lay out four reasons why we believe Indian equities are entering a window of historically attractive forward returns. Enjoy!
Indian equities continued to underperform regional peers in recent months, with the MSCI India Index declining 18.09% (in USD terms1) in Q1 2026. What began as a quarter of genuine optimism, anchored by landmark trade agreements and a growth-oriented Union Budget, was derailed by the escalation of the US-Israel military operation against Iran, which became the dominant risk event shaping global markets from late February onwards. The resulting energy shock, rupee depreciation, and record foreign investor selling erased the nascent recovery and pushed Indian equities to fresh lows by quarter-end. Foreign Institutional Investors (FIIs) net sold USD 12.7 billion of Indian equities in March, the largest-ever monthly outflow on record, bringing Q1 2026 net outflows to approximately USD 14.2 billion.2
All sectors ended lower for the quarter, though Health Care and Materials were the relative outperformers, while Real Estate and IT were the worst-performing sectors. IT continued to face headwinds from a global sell-off driven by the “SaaSpocalypse” narrative, as investors reassessed software valuations in light of accelerating AI-driven disruption. Real Estate was pressured by rising bond yields, weaker sentiment around rate-sensitive sectors, and fading expectations for further monetary easing as oil-driven inflationary concerns mounted.
The quarter delivered several significant positive catalysts that, in isolation, would have supported a meaningful re-rating. The India-EU free trade agreement announced in January and the India-US interim trade agreement in February, which reduced tariffs on Indian exports from 50% to 18%, together de-risked India’s external trade outlook materially. The FY27 Union Budget, presented on February 1, reinforced the government’s fiscal discipline while raising public capital expenditure to INR 12.2 trillion (~USD 133 billion), a 9% increase over FY26, and narrowing the fiscal deficit target to 4.3% of GDP.3 The Reserve Bank of India (RBI) retained the repo rate at 5.25% at its February policy review, following a cumulative 125 basis points (bps) of rate cuts delivered over 2025, with headline inflation remaining well within the 2-6% tolerance band.
Domestic activity indicators remained resilient for much of the quarter but softened noticeably in March. Manufacturing purchasing managers’ index (PMI) rose to a four-month high of 56.9 in February before falling sharply to 53.9 in March, a 45-month low, as cost pressures, softer domestic demand, and heightened uncertainty weighed on factory activity.4 Services PMI eased to 57.5 in March from 58.1 in February but remained well in expansionary territory. This marked the weakest reading in 14 months, as the conflict disrupted international travel and dampened sentiment.5 Input cost inflation hit a 43-month high in March, driven by higher prices for commodities including aluminum, chemicals, and fuels. However, a notable bright spot was export orders, which surged to record levels as Indian manufacturers secured new business across Asia, Europe, and the US.
Headline consumer price index (CPI) inflation, reported under the newly rebased 2024 series, rose to 3.21% y/y in February (from 2.75% in January), remaining comfortably within the RBI’s tolerance band. However, the sharp rise in oil prices since late February may push inflation higher in the coming months.
The ongoing conflict in the Middle East has triggered a sharp risk-off move across global markets. Asian equities have not been spared, dragged lower by the kind of “baby with the bathwater” correlations that have historically penalized emerging markets during global shocks. Foreign investors pulled an estimated ~USD 65 billion from Korea, Taiwan, and India in March alone, with India contributing the third-largest outflow in the region at -USD 12.7 billion.6
While the absence of a clear ceasefire remains a near-term dampener, negotiations are underway and making meaningful progress, validating our view that the March drawdown was a temporary dislocation. Markets appear to share this view – Asian equities rallied ~10% month-to-date as of April 13th, on the back of US-Iran negotiations, suggesting that the base case for a resolution is increasingly being priced in.
Our base case remains that the conflict will not escalate materially from here, and that it is in the interest of all parties to find an off-ramp. Negotiations have already made significant progress, and while the most difficult issues, particularly around Iran’s nuclear enrichment program, remain unresolved, neither side has shown an appetite for further escalation. We are optimistic that a middle ground will ultimately be found. China’s role will be critical in this regard; it is Beijing that has the leverage to bring Iran to the negotiating table, and we expect it to use that influence constructively. That said, we are not complacent. We are closely monitoring for signs of further escalation, and we acknowledge the tail risk that a prolonged US blockade of the Strait of Hormuz risks drawing China to the conflict in favor of Iran as they look to secure their energy supplies, which would meaningfully change the trajectory. For now, however, our central expectation is that all parties will seek a resolution in the near term, not least because the US has pressing reasons to move on.
Still, the market reaction overlooks a fundamental shift: Asian economies are more structurally resilient, less correlated to the conflict, and better positioned than in previous crises.
Before we turn to India specifically, two elements of the global backdrop are worth flagging as they directly reinforce the case for the region: the US political cycle and the evolving AI investment narrative. We cover both more in depth in our Asia Q1 2026 commentary, and summarize the key takeaways below.
The US is about to get preoccupied with domestic issues, and we believe markets are underestimating what that means for global capital allocation. The first half of any political term is the best window to tackle tough external challenges, and this administration has done exactly that: Iran, Venezuela, tariffs, immigration, and sanctions lists. The second half, heading into the midterms, will inevitably pivot toward the issues that drive electoral outcomes at home, namely affordability and job disruption. We expect US policymaking to become increasingly inward-looking and populist in tone, while the rest of the world, and Asia in particular, looks relatively more stable, predictable, and investor friendly by comparison.
The knock-on effect is a structural reallocation of global capital. The US represents approximately 30% of global GDP but nearly 60% of global market capitalization, an anomaly sustained by the perception of US exceptionalism and the dominance of US tech platforms. As US policymaking becomes more unpredictable and Asian policy frameworks continue to demonstrate stability and industrial focus, we expect that gap to narrow. This is not a short-term trade; it is a multi-year rebalancing that, in our view, has only just begun, and India is squarely in its path as one of the largest and most investable beneficiaries.
Since September 2025, we have been making the case that the next leg of the AI story belongs to the adopters, not the enablers. The fear in the market has been that OpenAI and similar large language model (LLM) platforms would directly disrupt existing consumer internet businesses. Our view has consistently been the opposite: incumbents with distribution, data, and brand equity would be the real winners, and that view is now being validated. OpenAI’s consumer ambitions have repeatedly stalled, with pullbacks on Sora, the quiet dismantling of its Walmart tie-up, and limited traction on its commerce and travel portals. LLMs look increasingly commoditized, while smart incumbents are integrating AI to improve targeting, engagement, and unit economics. At the same time, hyperscaler capex has grown from approximately USD 250 billion in 2024 to roughly USD 650 billion in 2026, and is running into power constraints, political pushback, and a private credit market increasingly financing AI infrastructure that is itself showing late-cycle warning signs.
The AI jobs debate deserves particular attention for India, given the country’s unique exposure through its IT services sector. On the surface, India looks vulnerable: the IT services industry employs almost 6 million people, and a significant share of revenue comes from exactly the kind of code generation, testing, and back-office work that LLMs are now capable of automating.7 This concern has been a key driver of IT sector underperformance over the past year.
However, we believe the narrative has become too one-sided. Indian IT companies have navigated multiple technology transitions over the past three decades, from mainframe to client-server, to the internet, to cloud, and each time the obituaries were written prematurely. What ultimately matters is whether these businesses can reposition themselves from being suppliers of labor to being suppliers of outcomes, and the leading players are already moving in that direction by embedding AI into their delivery models and charging for productivity gains rather than headcount. Moreover, the more immediate job disruption is arguably occurring in developed markets, where companies are realizing that a developer in India armed with AI can more than match the output of a senior developer in the US.
Beyond IT services, India’s broader labor market is structurally different from that of the US. The bulk of Indian employment sits in agriculture, manufacturing, construction, and informal services, segments that are far less exposed to LLM-driven disruption than US white-collar work. If anything, AI adoption in India is more likely to act as a productivity multiplier for a young, digitally literate workforce than as a displacement threat. The political economy backdrop is therefore very different from what we expect to unfold in the US: where Washington will increasingly have to defend its middle class from AI, India can lean into AI as a growth enabler without the same political constraints.
Against this backdrop of a US turning inward and an AI cycle beginning to mature, India is uniquely well-positioned. The March sell-off has been indiscriminate, but with the Middle East conflict abating, the underlying case for India has arguably never been stronger. Below, we lay out four reasons why we believe the current dislocation is a compelling buying opportunity.
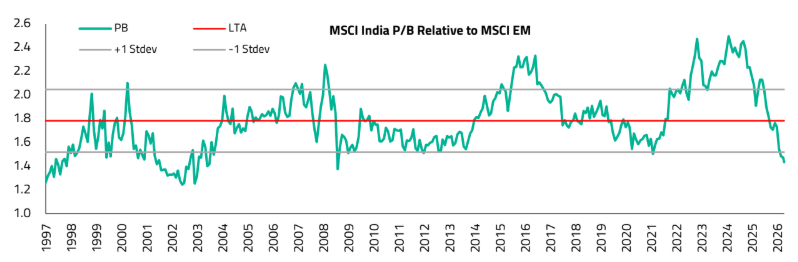
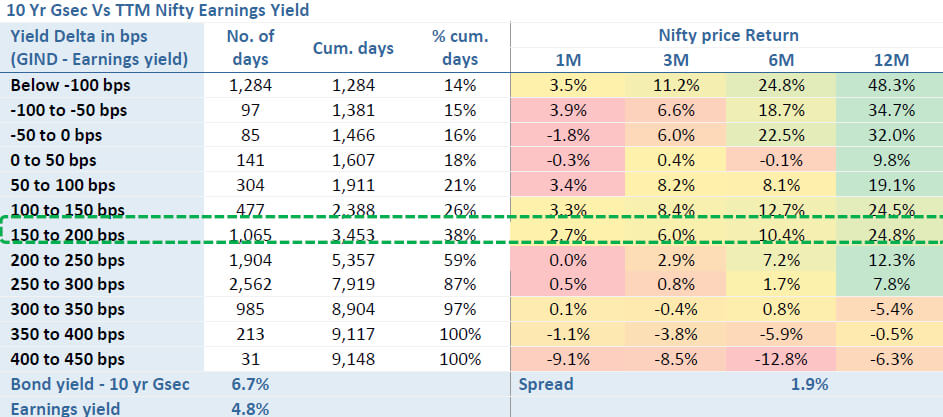
Perhaps most compelling of all, the Nifty earnings yield to 10-year government bond yield spread has widened to approximately 191 basis points, a level at which Indian equities have historically delivered average returns of around 25% over the subsequent twelve months.10 For long-term investors, the setup is rare: India’s structural growth story remains intact, yet the entry price has reset to levels we have not seen since the early pandemic period, and the historical return distribution at current valuation spreads skews decisively to the upside.
We have been active, not passive, through this pullback. The sharp correction has created an unusually attractive opportunity set across our coverage universe, and we have been selectively adding to high-conviction names where valuations have overshot to the downside. Our portfolio remains anchored in the structural themes we have highlighted throughout the past year: consumer platforms and discretionary consumption, industrials and domestic manufacturing, financials, and healthcare.
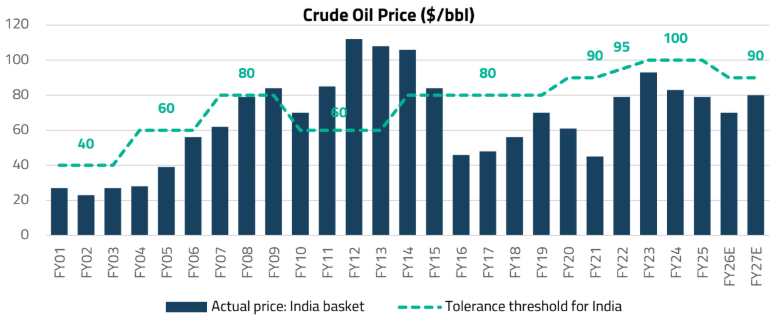
Our base case remains that the conflict will move toward resolution in the near term, driven by the strong economic incentives of multiple parties to de-escalate. Historical precedent shows that geopolitical oil shocks tend to create short-lived volatility, and markets typically look through the disruption once supply risks are quantified. When that inflection comes, we expect a rebound in Indian equities, and investors who are positioned ahead of it will benefit disproportionately.
Each quarter, we highlight a select number of companies that showcase exceptional growth potential. These stocks on our conviction list represent opportunities we believe will deliver substantial value over the coming years. Here are the standout stocks we’re featuring this quarter.
| Stock | Investment Rationale |
|---|---|
| Hindustan Zinc | Hindustan Zinc is one of the world’s largest integrated zinc and lead producers, but the real story is silver. Now contributing 15-20% of revenue and 40-50% of profit, silver has quietly transformed the company’s earnings profile. Our conviction rests on three drivers. First, Hindustan Zinc ranks among the top five global silver producers at a time when the silver market remains in structural deficit, with photovoltaic and electronics demand outpacing mine supply growth. Second, a fully integrated, low-cost operating base in Rajasthan delivers durable cost advantages versus global peers across the entire value chain. Third, while zinc fundamentals remain mixed given soft Chinese demand, the silver exposure provides a powerful offset and positions the company as a direct beneficiary of the precious metals cycle. With a fortress balance sheet and consistent dividend payouts, Hindustan Zinc offers rare listed-India exposure to a structurally tight global commodity. |
| AU Small Finance Bank | AU Small Finance Bank is a successful example of a Indian non-bank lender scaling into a full-service bank by serving the mid-tier (tier-2 and tier-3) markets that large private banks have long overlooked. AU has compounded its loan book at roughly 28% annually over the past five years, and the Fincare merger extends its footprint into southern India with fresh cross-sell opportunities. Additionally, multiple margin levers are converging: a richer product mix, improving disbursement yields, and a 62% fixed-rate book (the highest among peers) set to benefit disproportionately from RBI rate cuts. Finally, AU has applied for a universal bank license, which would unlock lower funding costs, eased priority sector requirements, and reduced capital intensity. With just 12% unsecured exposure, AU is insulated from the stress hitting peers, and positioned to deliver sector-leading earnings growth. |
| Narayana Hrudayalaya | Narayana Hrudayalaya is one of India’s leading private hospital chains, distinguished by its ability to deliver complex, high-quality clinical outcomes at a fraction of global costs through system design rather than wage arbitrage. As we detailed in our recent Asia Healthcare white paper, NARH’s Health City Cayman Islands operation has become a textbook case of operational transformation: EBITDA margins nearly doubled from approximately 22% in FY20 to 43% in FY25, while revenue per patient compounded at roughly 14% annually.12 The real prize, however, is the company’s recent acquisition of Practice Plus Group (PPG) in the UK, a major NHS partner currently running at approximately 10% EBITDA margins.13 Management expects margins to move into the mid-teens, with the acquisition turning EPS-accretive from FY27 and delivering 20-22% RoCE by the end of the decade.14 |
As we have shared with many of our investors, the world today is going to be noisy, uncertain, and at times exhausting to navigate. Environments like this demand exceptional leaders, the kind who can see through the short-term fog and build businesses that compound for the coming years. A few extraordinary companies, run by a few extraordinary leaders, will rise above the rest through this environment. These are the companies that we look for, and it is also the kind of company that we strive to be.
For sophisticated investors only. For informational purposes only. The information presented in the material is not, and may not be relied on in any manner as legal, tax, investment, accounting or other advice or as an offer to sell or a solicitation of an offer to buy an interest in any investment product or any other entity sponsored or managed by Shikhara Investment Management. This material doesn’t constitute and should not be considered as any form of financial opinion or recommendation.
This material is prepared by Shikhara Investment Management LP (“Shikhara”). This material does not constitute an offer to sell or the solicitation of an offer to buy in any state of the United States or other U.S. or non-U.S. jurisdiction to any person to whom it is unlawful to make such offer or solicitation in such state or jurisdiction.
Investment involves risk. Past performance is not indicative of future performance. It cannot be guaranteed that the performance of the investment product will generate a return and there may be circumstances where no return is generated. Investors could lose all or a substantial portion of any investment made. Before making any investment decision, investors should read the Prospectus for details and the risk factors. Investors should ensure they fully understand the risks associated with the investment product and should also consider their own investment objective and risk tolerance level. Investors are advised to seek independent professional advice before making any investment.
Shikhara’s investment products are suitable only for sophisticated investors and require the financial ability and willingness to accept the high risks and lack of liquidity inherent in Shikhara’s investment products. Prospective investors must be prepared to bear such risks for an indefinite period of time. No assurance can be given that the investment objectives of any given investment product will be achieved or that investors will receive a return of their investment.
Certain of the information contained in this material are statements of future expectations and other forward-looking statements. Views, opinions and estimates may change without notice and are based on a number of assumptions which may or may not eventuate or prove to be accurate. Actual results, performance or events may differ materially from those in such statements.
Certain information contained in this material is compiled from third-party sources. Whereas Shikhara has, to the best of its endeavor, ensured that such, information is accurate, complete and up-to-date, and has taken care in accurately reproducing the information, Shikhara takes no responsibility for the accidental publication of incorrect information, nor for investment decisions taken based on this material. Neither Shikhara nor any of its affiliates makes any representation or warranty, express or implied, as to the accuracy or completeness of the information contained herein, and nothing contained herein should be relied upon as a promise or representation as to past or future performance of any investment product or any other entity.
The contents of this material are prepared and maintained by Shikhara and has not been reviewed by the Securities and Exchange Commission of the United States.
The Fund managed by Shikhara may or may not hold all of, or some of the securities mentioned in the article.
The Shikhara logo and name are trademarks of Shikhara Investment Management LP, registered in Hong Kong, the People’s Republic of China (PRC), Australia, the United Kingdom, the European Union, and in the United States.
This website is published exclusively for the purpose of providing general information about the management services carried out by Shikhara Investment Management LP, Shikhara Capital (Hong Kong) Private Limited and its affiliates (collectively “Shikhara Investment Management” or “Shikhara”). The information presented on the website is not, and may not be relied on in any manner as legal, tax, investment, accounting, or other advice or as an offer to sell or a solicitation of an offer to buy an interest in any investment product or any other entity sponsored or managed by Shikhara Investment Management. This website doesn’t constitute and should not be considered as any form of financial opinion or recommendation.
Shikhara Investment Management LP is currently an Exempt Reporting Adviser that is exempt from registration as an investment adviser with the U.S. Securities and Exchange Commission and Shikhara Capital (Hong Kong) Private Limited has been approved by the Hong Kong Securities and Futures Commission. This website does not constitute an offer to sell or the solicitation of an offer to buy in any state of the United States or other U.S. or non-U.S. jurisdiction to any person to whom it is unlawful to make such offer or solicitation in such state or jurisdiction.
Investment involves risk. Past performance is not indicative of future performance. It cannot be guaranteed that the performance of the investment product will generate a return and there may be circumstances where no return is generated. Investors could lose all or a substantial portion of any investment made. Before making any investment decision, investors should read the Prospectus for details and the risk factors. Investors should ensure they fully understand the risks associated with the investment product and should also consider their own investment objective and risk tolerance level. Investors are advised to seek independent professional advice before making any investment.
Shikhara’s investment products are suitable only for sophisticated investors and require the financial ability and willingness to accept the high risks and lack of liquidity inherent in Shikhara’s investment products. Prospective investors must be prepared to bear such risks for an indefinite period of time. No assurance can be given that the investment objectives of any given investment product will be achieved or that investors will receive a return of their investment.
Certain of the information contained in this website are statements of future expectations and other forward-looking statements. Views, opinions, and estimates may change without notice and are based on a number of assumptions which may or may not eventuate or prove to be accurate. Actual results, performance, or events may differ materially from those in such statements.
Certain information contained in this website is compiled from third-party sources. Whereas Shikhara Investment Management has, to the best of its endeavor, ensured that such information is accurate, complete, and up-to-date, and has taken care in accurately reproducing the information, Shikhara Investment Management takes no responsibility for the accidental publication of incorrect information, nor for investment decisions taken based on this website. Neither Shikhara Investment Management nor any of its affiliates makes any representation or warranty, express or implied, as to the accuracy or completeness of the information contained herein, and nothing contained herein should be relied upon as a promise or representation as to past or future performance of any investment product or any other entity.
The contents of this website are prepared and maintained by Shikhara Investment Management and has not been reviewed by the Securities and Exchange Commission of the United States or the Securities and Futures Commission of Hong Kong.
The Shikhara logo and name are trademarks of Shikhara Investment Management LP, registered in Hong Kong, the People’s Republic of China (PRC), Australia, the United Kingdom, the European Union, and the United States.