
November reminded investors that volatility is the price of admission. Yet beneath the turbulence of carry trade unwinds, liquidity squeezes, and private credit jitters, a more constructive picture is emerging. This month, we unpack the technical drivers behind the sell-off, explore how state-led innovation is reshaping global competition, and explain why Asian equities remain compelling. As monetary easing broadens and policy uncertainty fades, the case for Asia continues to strengthen.
The MSCI All Country Asia Ex-Japan Index fell 2.83% (in USD terms1) over the month of November. Relative to the rest of the region, Hong Kong and the Philippines were the top performers, while South Korea and Taiwan were the laggards. Sector-wise, Energy and Financials led performance, while IT and Consumer Discretionary were the worst performers.
MSCI China declined 2.50% in November, consolidating further after October’s pullback. The month saw a sharp reversal in sentiment towards AI and technology stocks globally, with concerns over stretched valuations weighing on the market. China’s October economic data was mixed, with industrial production expanding 4.9% y/y (a slowdown from September’s 6.5% but showing steady growth in high-tech sectors) and retail sales rising 2.9% y/y (in line with expectations), while fixed asset investment contracted 1.7% y/y for the first 10 months of 2025. CPI inflation turned positive at 0.2% y/y in October, ending a period of deflation, driven by holiday demand for services like travel and food. The official manufacturing Purchasing Manager’s Index (PMI) improved modestly to 49.2 in November (vs 49.0 in October), partly reflecting relief from the US-China trade agreement reached in late October, which lowered fentanyl-related tariffs and suspended port fees and other trade restrictions.
Indian equities edged up 0.89% in November, extending their recovery for the third consecutive month. The highlight of the month was the release of Q2 FY26 GDP data, which came in at a stronger-than-expected 8.2% y/y, recording the fastest pace in six quarters and well above the RBI’s projection of 7%. Manufacturing expanded 9.1% and services rose 9.2%, while private final consumption expenditure (PFCE) grew 7.9%, supported by income tax cuts and robust rural demand. The Nifty 50 and Sensex quietly hit fresh all-time highs during the month, driven by optimism around domestic consumption recovery and expectations for a 25bp RBI rate cut in December (which was confirmed on 5 December). However, gains were capped by foreign outflows and Rupee weakness, with the Indian Rupee hitting record lows above 89 against the US dollar.
Korean equities tumbled 7.88% in November, giving back a significant portion of October’s gains as the global AI valuation reassessment hit semiconductor names hard. The KOSPI, which had hit record highs above 4,100 in October, fell sharply mid-month as foreign investors pulled approximately USD 5 billion from the market in the first week of November alone, reversing the USD 4.2 billion in inflows from the prior month. Samsung Electronics and SK Hynix bore the brunt of the selling, as concerns over stretched AI valuations and reports of memory chip buyers diversifying towards Chinese suppliers weighed on sentiment. However, markets stabilized in the latter half of the month as sentiment improved, with the KOSPI recovering towards 4,000 as expectations for Fed rate cuts and continued AI demand provided support.
Taiwanese equities declined 5.01% in November, as the global reassessment of AI valuations spilled over into the market and TSMC. The selloff was exacerbated by concerns over whether AI infrastructure spending would generate sufficient near-term returns. However, markets recovered somewhat in late November as expectations for a December Fed rate cut gained traction and Nvidia’s strong earnings reaffirmed confidence in AI demand.
ASEAN equities posted mixed results in November, with the Philippines (+2.22%) and Malaysia (+1.21%) leading, while Thailand (-2.41%) lagged. Thailand underperformed on continued foreign outflows, weak economic data, and political uncertainty. Elsewhere, Indonesia gained 1.14% as the JCI reached fresh all-time highs above 8,300, supported by Indonesia’s GDP growth of 5.04% y/y in Q3, resilient domestic consumption, and strong IPO activity. Singaporean equities rose marginally in November (+0.29%), with the STI also hitting all-time highs during the month, supported by local banks, rate cut expectations, and MAS-SGX reform initiatives aimed at revitalizing the equity market.
November’s market turbulence tested investor resolve across global risk assets, but we view these periodic corrections as healthy recalibrations rather than harbingers of systemic distress. While pinpointing a single catalyst is difficult, the sell-off appears driven by a confluence of technical and liquidity factors:
While unsettling in the near term, we think these developments represent the kind of course corrections that maintain market discipline and prevent excessive speculation. Central banks (e.g. US Federal Reserve and Bank of Japan) have demonstrated coordination capabilities during past carry trade unwinds. Moreover, sovereign risk in developed markets, while elevated, does not present an immediate threat despite bond yields trending higher.
Instead, there are three key factors that lead us to remain positive:
Importantly, the easing cycle is broadening globally. Falling global rates typically weaken the US dollar, ease external financing conditions, and redirect capital toward regions with stronger growth differentials. Emerging markets, particularly in Asia, stand to benefit from lower funding costs, improved currency stability, and greater policy flexibility, creating a supportive backdrop for corporate earnings and equity performance.
More significantly, the administration has recently launched the Genesis Mission (described as “comparable in urgency and ambition to the Manhattan Project”) to harness AI for scientific discovery.4 The initiative will mobilize the Department of Energy’s 17 National Laboratories, industry, and academia to build an integrated AI platform drawing on federal scientific datasets to train foundation models and accelerate breakthroughs in biotechnology, nuclear fusion, quantum computing, semiconductors, and space exploration.
Japan is pursuing a parallel strategy. The government is set to designate six fields (including AI, nuclear fusion, biotechnology, quantum technology, space, and semiconductors) as “national strategic technologies”, prioritizing them for research funding and preferential tax treatment. Japan’s Fusion Energy Innovation Strategy has been updated to target electricity generation from fusion by the 2030s, advancing its original 2050 goal. The US-Japan Technology Prosperity Deal signed in October 2025 further deepens collaboration on AI, fusion energy, and space exploration.
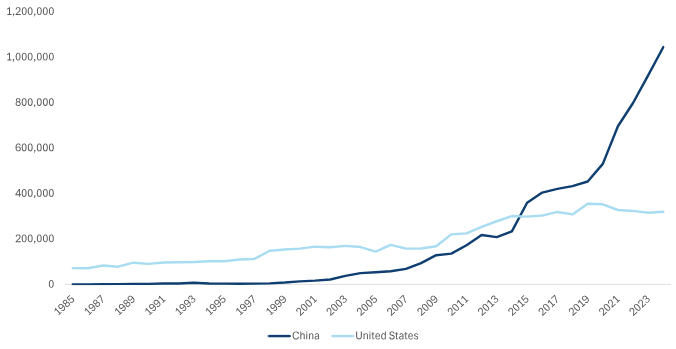
Meanwhile, China’s state-led innovation drive is already yielding visible results. The country granted over 1 million new patents in 2024, over 3 times more than the US and underscoring how rapidly the global innovation balance is shifting.5
This reminds us of the Sputnik era, when superpower competition led to unprecedented innovation. That period spawned the invention of the internet (ARPANET), GPS, integrated circuits and advanced computing, and satellite communications. When great powers compete technologically with strategic funding, innovations extend far beyond military purposes to profound commercial and consumer applications.
The administration has tacitly acknowledged this, rolling back tariffs on over 200 food products (including beef, coffee, and tropical fruits) in mid-November, alongside tariff reductions from trade framework agreements with Ecuador, Guatemala, El Salvador, Argentina, and Switzerland. The Congressional Budget Office (CBO) estimates that more than one-third of imports are now unaffected by tariff rate increases.6 US-China relations have also shown meaningful improvement following the Trump-Xi summit in South Korea on October 30th, with the resulting trade framework including significant de-escalation measures.
So, with the 2026 midterms approaching, we think it’s in US policymakers’ interest to iron out supply chain issues and bring inflation under control, which in turn creates space for the Fed to continue easing. As tariff uncertainty recedes, business confidence should improve, and deferred investment plans will resume.
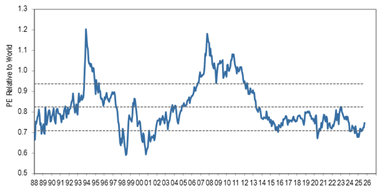
Crucially, from an Asia perspective, Asian equities remain well-positioned to capture these tailwinds. The Asia ex-Japan earnings revision ratio reached 1.05 in October (its highest level in over four years) with EPS forward guidance broadening and accelerating. Yet despite these improving fundamentals, the region trades at a 25% discount to global peers. While relative valuations alone are not a catalyst for rotation, this combination of strengthening earnings momentum and attractive pricing presents a compelling case for continued foreign inflows into Asian markets.
Of course, we also must address November’s AI-driven volatility. The correction reflected legitimate concerns about valuation and capital intensity, but beneath the volatility, real commercialization is accelerating. Tencent’s Q3 2025 results provided one of the first detailed quantification of AI’s economic impact we’ve observed from a major platform. The company reported that that AI-powered ad targeting contributed roughly half of the 21% y/y growth in marketing services revenue.7
This matters because it validates the investment thesis that has driven capital expenditure across the sector. Yes, AI infrastructure requires enormous upfront investment. But as corporates like Tencent begin quantifying returns, the path to positive ROI becomes clearer, leading to greater mass adoption.
As we mentioned in last month’s note about the AI infrastructure buildout, not all participants will earn compelling returns. The risk sits with high-capex builders lacking scale advantages, ecosystem integration, or clear monetization pathways. Instead, where we see sustainable value creation accruing is at the corporate level, in 1) companies successfully integrating AI into customer-facing products that drive top-line growth, and 2) companies achieving measurable operational efficiencies that improve margins. The evidence of the AI value creation is only just beginning to show.
Our investment approach is deliberately unconstrained, spanning the growth-value spectrum to capture the best opportunities in Asian markets. While we focus on innovative, high-growth companies, we equally pursue deep value situations where competitive dynamics are evolving in growth opportunities.
KEPCO, Korea’s state-owned utility monopoly, illustrates both this philosophy and how we think differently about global themes. The company has been forced to sell electricity below cost due to government price controls – a politically driven subsidy model similar to China’s energy sector. However, with stable demand and the government gradually raising tariffs to restore financial viability, we see significant upside as this essential infrastructure provider returns to profitability. More importantly, KEPCO exemplifies our conviction that a healthy, profitable utility sector is the crux of any reindustrialization theme. Korea’s industrial base (including shipbuilding, defense, advanced manufacturing) cannot expand without reliable, economically sustainable power infrastructure.
As the world embraces the reindustrialization narrative, particularly in the US and Europe, we believe Korea stands as the biggest beneficiary in Asia. The country possesses the industrial capacity, supply chain integration, and technological expertise to capitalize on this shift. This is how we look at the world differently: connecting macro themes and perspectives from multiple geographic locations to mispriced, essential assets that other investors may overlook.
Outside of Korea, China remains a key portfolio weight, though we have reduced exposure in names that performed well this year. While US-China relations have stabilized somewhat, domestic growth recovery will be gradual, characterized by a K-shaped consumption pattern. We are therefore focusing on businesses that are both globally competitive and operate in sectors with limited domestic competitive intensity, i.e. companies that can thrive regardless of China’s internal dynamics.
With reduced China exposure, we have been adding to India, where we see a compelling competitive evolution unfolding. Leading Indian industrials have spent the past decade developing international customer relationships while simultaneously upgrading product quality and manufacturing processes. This dual capability of global market access combined with operational excellence is now enabling these companies to expand into adjacent, higher-value segments. For example, auto parts suppliers are leveraging their proven manufacturing capabilities to enter aerospace components, demonstrating the export optionality that makes Indian industrials increasingly attractive. This represents exactly the type of structural upgrade story we seek: companies transcending their domestic origins and expanding their market to become global competitors.
For sophisticated investors only. For informational purposes only. The information presented in the material is not, and may not be relied on in any manner as legal, tax, investment, accounting or other advice or as an offer to sell or a solicitation of an offer to buy an interest in any investment product or any other entity sponsored or managed by Shikhara Investment Management. This material doesn’t constitute and should not be considered as any form of financial opinion or recommendation.
This material is prepared by Shikhara Investment Management LP (“Shikhara”). This material does not constitute an offer to sell or the solicitation of an offer to buy in any state of the United States or other U.S. or non-U.S. jurisdiction to any person to whom it is unlawful to make such offer or solicitation in such state or jurisdiction.
Investment involves risk. Past performance is not indicative of future performance. It cannot be guaranteed that the performance of the investment product will generate a return, and there may be circumstances where no return is generated. Investors could lose all or a substantial portion of any investment made. Before making any investment decision, investors should read the Private Placement Memorandum for details and the risk factors. Investors should ensure they fully understand the risks associated with the investment product and should also consider their own investment objective and risk tolerance level. Investors are advised to seek independent professional advice before making any investment.
Shikhara’s investment products are suitable only for sophisticated investors and require the financial ability and willingness to accept the high risks and lack of liquidity inherent in Shikhara’s investment products. Prospective investors must be prepared to bear such risks for an indefinite period of time. No assurance can be given that the investment objectives of any given investment product will be achieved or that investors will receive a return of their investment.
Certain of the information contained in this material are statements of future expectations and other forward-looking statements. Views, opinions, and estimates may change without notice and are based on a number of assumptions which may or may not eventuate or prove to be accurate. Actual results, performance or events may differ materially from those in such statements.
Certain information contained in this material is compiled from third-party sources. The information and any opinions contained in this document have been obtained from sources that Shikhara considers reliable, but Shikhara does not represent that such information and opinions are accurate or complete, and thus should not be relied upon as such. Furthermore, all opinions are current only as of the date of distribution and are subject to change without notice. Shikhara does not have any obligation to provide revised opinions in the event of changed circumstances. Whereas Shikhara has, to the best of its endeavor, ensured that such information is accurate, complete, and up-to-date, and has taken care in accurately reproducing the information, Shikhara takes no responsibility for the accidental publication of incorrect information, nor for investment decisions taken based on this material. Neither Shikhara nor any of its affiliates makes any representation or warranty, express or implied, as to the accuracy or completeness of the information contained herein, and nothing contained herein should be relied upon as a promise or representation as to past or future performance of any investment product or any other entity.
The MSCI AC Asia ex Japan Index captures large and mid-cap representation across Developed Markets (DM) countries (excluding Japan) and Emerging Markets (EM) countries in Asia. The index covers approximately 85% of the free float-adjusted market capitalization in each country. The MSCI China Index captures large and mid-cap representation across China A shares, H shares, B shares, Red chips, P chips, and foreign listings (e.g. ADRs). The index covers about 85% of the Chinese equity universe.
The contents of this material are prepared and maintained by Shikhara and have not been reviewed by the Securities and Exchange Commission of the United States.
The Shikhara logo and name are trademarks of Shikhara Investment Management LP, registered in Hong Kong, the People’s Republic of China (PRC), Australia, the United Kingdom and the European Union and pending registration in the United States.
This website is published exclusively for the purpose of providing general information about the management services carried out by Shikhara Investment Management LP, Shikhara Capital (Hong Kong) Private Limited and its affiliates (collectively “Shikhara Investment Management” or “Shikhara”). The information presented on the website is not, and may not be relied on in any manner as legal, tax, investment, accounting, or other advice or as an offer to sell or a solicitation of an offer to buy an interest in any investment product or any other entity sponsored or managed by Shikhara Investment Management. This website doesn’t constitute and should not be considered as any form of financial opinion or recommendation.
Shikhara Investment Management LP is currently an Exempt Reporting Adviser that is exempt from registration as an investment adviser with the U.S. Securities and Exchange Commission and Shikhara Capital (Hong Kong) Private Limited has been approved by the Hong Kong Securities and Futures Commission. This website does not constitute an offer to sell or the solicitation of an offer to buy in any state of the United States or other U.S. or non-U.S. jurisdiction to any person to whom it is unlawful to make such offer or solicitation in such state or jurisdiction.
Investment involves risk. Past performance is not indicative of future performance. It cannot be guaranteed that the performance of the investment product will generate a return and there may be circumstances where no return is generated. Investors could lose all or a substantial portion of any investment made. Before making any investment decision, investors should read the Prospectus for details and the risk factors. Investors should ensure they fully understand the risks associated with the investment product and should also consider their own investment objective and risk tolerance level. Investors are advised to seek independent professional advice before making any investment.
Shikhara’s investment products are suitable only for sophisticated investors and require the financial ability and willingness to accept the high risks and lack of liquidity inherent in Shikhara’s investment products. Prospective investors must be prepared to bear such risks for an indefinite period of time. No assurance can be given that the investment objectives of any given investment product will be achieved or that investors will receive a return of their investment.
Certain of the information contained in this website are statements of future expectations and other forward-looking statements. Views, opinions, and estimates may change without notice and are based on a number of assumptions which may or may not eventuate or prove to be accurate. Actual results, performance, or events may differ materially from those in such statements.
Certain information contained in this website is compiled from third-party sources. Whereas Shikhara Investment Management has, to the best of its endeavor, ensured that such information is accurate, complete, and up-to-date, and has taken care in accurately reproducing the information, Shikhara Investment Management takes no responsibility for the accidental publication of incorrect information, nor for investment decisions taken based on this website. Neither Shikhara Investment Management nor any of its affiliates makes any representation or warranty, express or implied, as to the accuracy or completeness of the information contained herein, and nothing contained herein should be relied upon as a promise or representation as to past or future performance of any investment product or any other entity.
The contents of this website are prepared and maintained by Shikhara Investment Management and has not been reviewed by the Securities and Exchange Commission of the United States or the Securities and Futures Commission of Hong Kong.
The Shikhara logo and name are trademarks of Shikhara Investment Management LP, registered in Hong Kong, the People’s Republic of China (PRC), Australia, the United Kingdom, the European Union, and the United States.