


Just as the technology trade that carried the first half of the year appeared unassailable, it wavered, and Korea offered a vivid lesson in how quickly a crowded market can turn. This month, we reflect on what the market’s sharp swings teach us about positioning, why credit markets may be sending a more honest signal than equities about the sustainability of the current capex cycle, and why historically extreme sector dispersions tend to resolve in favor of balanced portfolios. Enjoy!
The MSCI All Country Asia Ex-Japan Index fell 3.18% (in USD terms1) in July, marking a sharp reversal of the AI-led trade that had driven markets through the first half of the year. A global semiconductor selloff that began in US chip names late in the month spread across Asia, unwinding crowded positions in the North Asian AI complex. South Korea and Taiwan were the region’s laggards, while China, Indonesia, Singapore, and Hong Kong led. The move was concentrated in Information Technology (-12.65%) and Industrials (-6.55%), while every other sector advanced, led by Consumer Discretionary and Real Estate.
MSCI China rose 9.49% in July, rallying even as the hard data disappointed. Q2 GDP slowed to 4.3% y/y, the weakest pace since Q4 2022, taking first-half growth to 4.7%.2 Both official purchasing managers’ indices (PMI) slipped into contraction in July, with manufacturing PMI at 49.2 (vs 50.3 in June) and non-manufacturing PMI at 49.0 (vs 50.2).3 Against that soft backdrop, the market was driven by a rotation into attractively valued internet and technology names, by expectations of additional policy support around the late-July Politburo meeting, and by a broadening of leadership away from the crowded North Asian AI trade. Hong Kong also advanced in parallel, supported by firm southbound flows and the same rotation into large-cap internet platforms.
Indian equities rose 1.78%, driven by a return of foreign buying alongside resilient domestic demand. Retail inflation accelerated to 4.38% in June, the highest reading since December 2024 and above the 4% midpoint of the Reserve Bank of India’s target band, as the earlier energy shock fed through to fuel and firmer food prices.4 Business activity cooled in July, with manufacturing PMI easing to 53.5 (vs 54.2 in June), while services PMI fell more sharply to 53.3 from 57.4 on slower domestic demand and stronger competition.5 The India-UK Comprehensive Economic and Trade Agreement took effect on July 15, eliminating tariffs on around 99% of Indian exports to the United Kingdom.
South Korea was the region’s weakest market by a wide margin, tumbling 17.11%, even as its export engine set fresh records. July exports rose 62.8% y/y to a record USD 98.9 billion, with semiconductor shipments above USD 40 billion for a second consecutive month and the trade surplus exceeding USD 30 billion.6 The disconnect defined the month: the KOSPI posted one of its steepest monthly declines in decades as the AI trade unwound, with investors questioning earnings sustainability, the index’s heavy concentration in a handful of memory names, and the prospect of intensifying competition from Chinese chipmakers. The sell-off spread beyond tech, with circuit breakers and margin calls on leveraged retail positions triggering broad-based selling across all sectors in Korea.
Taiwanese equities fell 5.29%, correcting alongside the broader chip complex after months of AI-driven gains. The decline was led by the large-cap semiconductor names that dominate the index, which fell in sympathy with a sharp drop in US chip shares even as second-quarter earnings and export data stayed strong. The underlying demand backdrop was little changed, with the move largely reflecting positioning and valuation rather than a deterioration in fundamentals.
Within ASEAN, performance rebounded broadly as capital rotated toward cheaper, less AI-exposed markets. Indonesia (+11.17%) was the standout, extending a recovery from its early-June low after S&P Global Ratings affirmed the sovereign rating with a stable outlook mid-month and Bank Indonesia unexpectedly held its policy rate at 5.75%, pausing hikes delivered since May.7 However, the looming November MSCI review of the market’s classification remains an overhang. Singapore (+10.22%) advanced with the Straits Times Index at record highs, helped by an advance estimate showing Q2 GDP growth of 5.7%, led by a 12.2% expansion in manufacturing on AI-related demand, and by the defensive, bank-heavy composition that benefits as leadership broadens.8 The Philippines (+6.24%) and Malaysia (+3.99%) also gained, while Thailand (-0.33%) was broadly flat.
Korea’s violent swings this month reinforced why we would rather own a balanced portfolio than chase a narrow, momentum-driven rally.
The focus for this month centered on the wave of global tech earnings and on what the market’s violent swings continue to teach us about how to be positioned. The pattern of the first half of the year was, in a word, indiscriminate: technology was bid up while almost everything else was sold, with little regard for the underlying businesses. What has changed over recent weeks is that the market has begun to recognize a distinction we have drawn for some time, namely that the larger prize may lie less with the companies building the AI than with the companies using it to strengthen their own franchises. If June and July carry a single lesson, it is that this market moves extraordinarily fast, and that the best defense against that speed is a balanced portfolio rather than a concentrated wager on any one outcome.
Korea illustrated the point in the sharpest possible terms. When the selloff came, it was not confined to semiconductors; the entire market was sold, and a number of high-quality businesses with strong operating momentum were swept up as collateral damage. Eugene Technology, a maker of DRAM production equipment, had risen over 3x over 12 months to end-June, only to surrender two-thirds of the move in the month of July, even as its order book and earnings prospects remained intact. Korean shipbuilders and defense-linked industrials, whose fundamental stories are, if anything, improving, also fell alongside the chipmakers.
We regard dislocations of this kind as opportunities. A business that falls 30-40% for reasons unrelated to its own prospects can recover that ground quickly, though experience tells us the rebound tends to arrive only once broader confidence returns, not before. For us, the episode reinforces the non-technology side of the portfolio, where valuations now sit well below what the underlying momentum would justify.
There is a further lesson in how Korea arrived at this point. Over the past two years, Korean policymakers came increasingly to measure national success by the level of the stock market, treating a rising index as a barometer of policy achievement. That is a double-edged sword. The euphoria it encouraged drew in enormous interest and investment, but it also invited the very speculation that is now prompting the authorities to tighten conditions, and those restraining measures are only beginning to be felt. It is a useful reminder, for policymakers and investors alike, that equities are not a one-way street.
Higher rates are forcing a harder look at AI capex economics just as consensus earnings growth estimates show the outlook decelerating sharply from here.
Standing behind these moves is a single variable that is often overlooked: the level of interest rates. Reality checks in markets tend to arrive when rates are high, because that is when the cost of capital forces a harder look at the economics of any undertaking. For much of the past decade the opposite conditions prevailed. Rates were low, China was recycling its surpluses into US Treasuries, and capital was abundant and cheap, which allowed ambitious buildouts to proceed with little scrutiny of their returns.
Those conditions have reversed. Liquidity is now tight, governments are borrowing heavily, and weak fiscal positions that were easy to overlook have become a genuine source of concern. Governments everywhere are contending with strained fiscal positions, whether it’s high deficits, weak revenues, or balance-of-payments pressures. In the UK, successive rounds of tax increases on businesses and higher earners have been driven by a Treasury struggling to reconcile spending commitments with sluggish growth. Across Europe, fiscal rules are tightening again even as governments face rising defence and energy costs. And in the US, the federal deficit remains structurally wide, and the political debate over who should bear the burden of closing it is intensifying. In Asia, the pressures are no less acute. China has recently launched a sweeping campaign to recover hundreds of billions of dollars in unpaid taxes going back decades, targeting the ultra-wealthy as Beijing seeks to fill a deepening fiscal hole and discourage further capital flight. India faces its own combination of fiscal and current-account constraints.
The risk this creates for AI capex is underappreciated. A significant portion of the population, especially in developed economies, has not participated in the wealth effect of recent years, and that discontent is finding expression at the ballot box. In the US, the long march of Corporate America toward ever-higher margins has only sharpened the contrast between those who have benefited and those who have not. Politicians who recognize this will be the ones who win office, and their instinct will not be to protect the capex runway of a handful of technology companies but to slow the pace, tighten regulation, and insist that the gains are shared more broadly. It may seem at odds with market logic, but a large share of the electorate has been left behind, and they will make themselves heard.
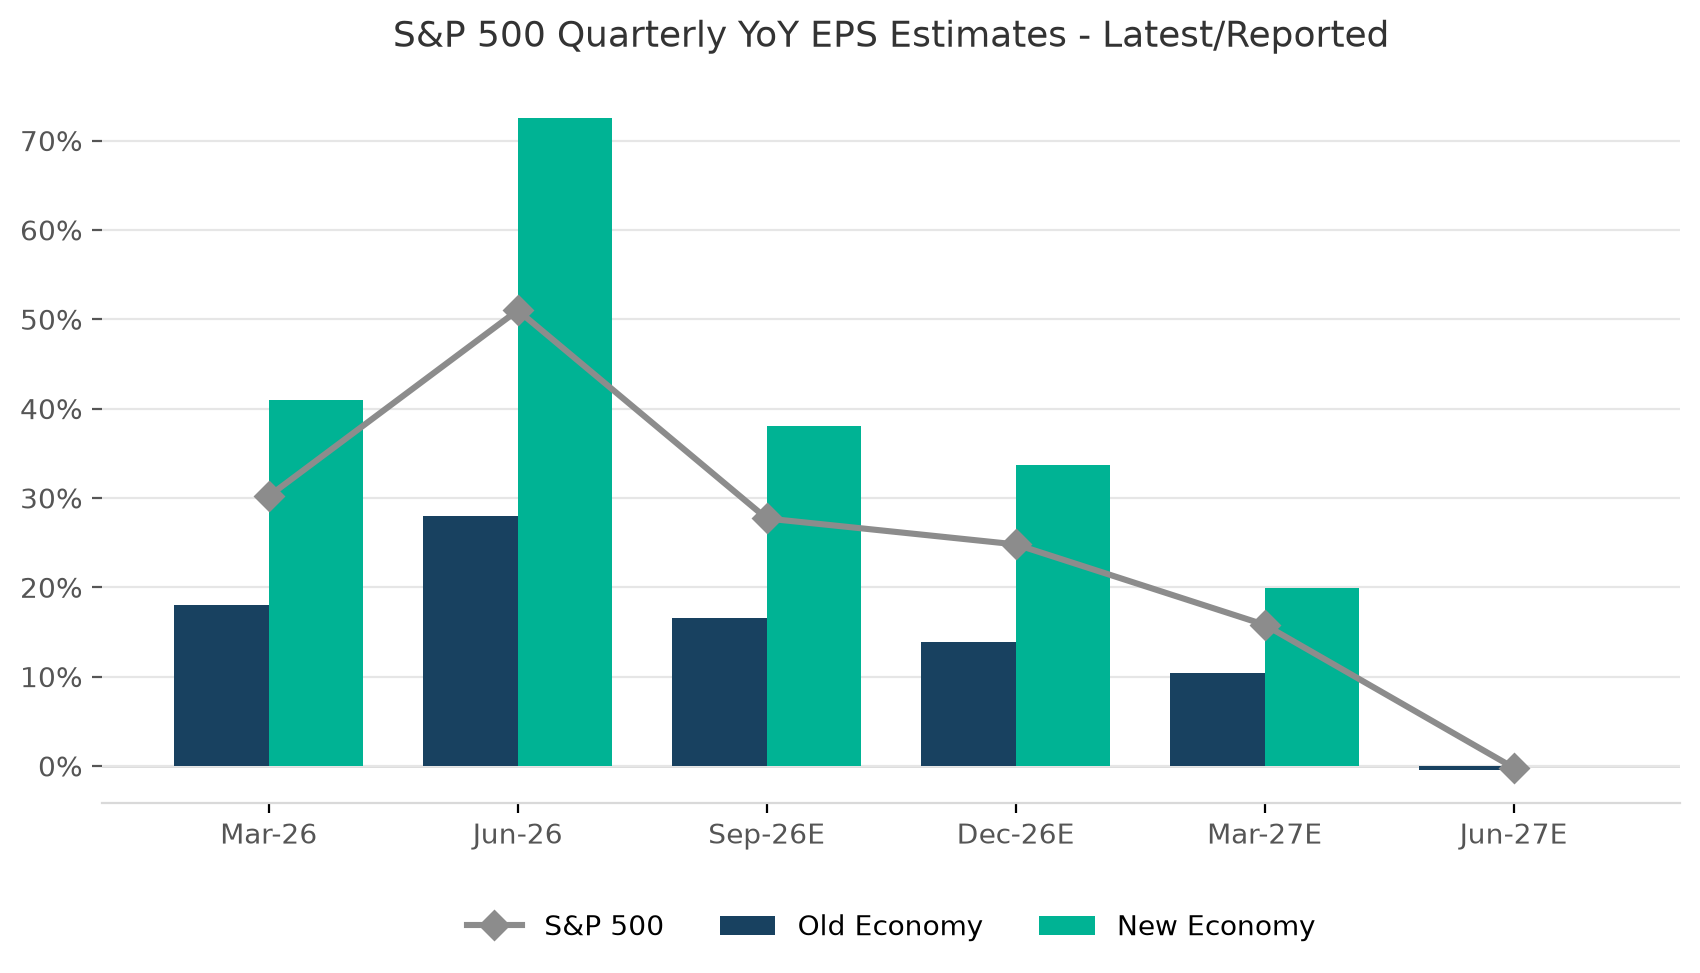
It is against this backdrop that the returns of AI enablers are being tested. The recent rebound in technology, powered by strong results from the large cloud businesses, confirmed that genuine adoption is under way and that compute remains in real shortage, even as the competitive dynamics among the models themselves continue to point toward commoditization. The headline numbers were impressive: S&P 500 EPS growth came in at roughly 51% y/y, with ‘New Economy’ sectors9 at over 70% but a significant portion of that was flattered by unrealized AI-related paper gains.10 Strip those out and real earnings growth was closer to 30% y/y for the index and 33% for the New Economy cohort. On a quarter-on-quarter basis, real earnings growth was actually negative for the New Economy cohort. The outlook ahead is even more sobering – consensus estimates point to S&P 500 EPS growth decelerating sharply from ~51% in Q2 2026 to near-zero by mid-2027, with New Economy sectors fading from over 70% to flat over the same period.
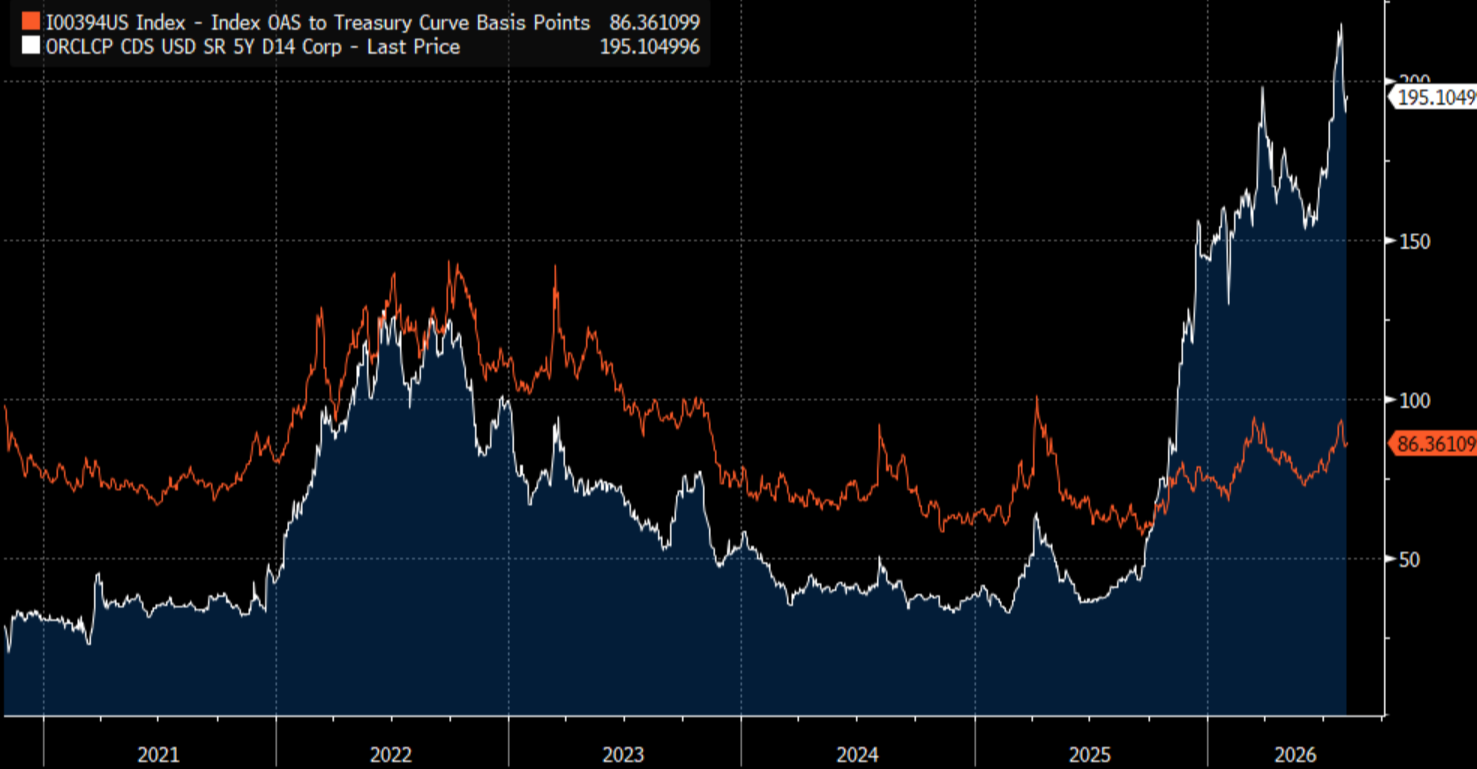
The bigger question is whether current valuations still assume a pace and scale of data center capex that may or may not materialize. Credit markets are already offering a hint – spreads on the major hyperscalers have been widening even as their equity prices recovered, a divergence that tends to resolve in credit’s favor. US IG tech credit spreads have widened from their tights, but the more telling signal is in single-name risk: Oracle’s 5-year CDS has blown out to ~200bps, sharply decoupling from the broader index. Unlike Microsoft or, to some extent, Amazon, which can largely self-fund their AI buildout from free cash flow, Oracle is debt-financing its way into the capex arms race, and the credit market is pricing that distinction aggressively. As buybacks slow and free cash flow is consumed by capex, the balance-sheet cushion that has underwritten these companies’ premium valuations will likely thin.
US IG Tech Credit Spreads vs Oracle 5-year CDS (bps)
We would not be surprised to see the eventual capex figures land 20-30% below current expectations, as regulatory and execution risks begin to appear. In Q1 this year alone, at least 75 data center projects valued at roughly USD 130 billion were blocked or delayed across the US – a pace that matched the whole of 2025 in a single quarter.11 New York has gone the furthest: in July, Governor Hochul signed the first statewide moratorium on new hyperscale data centers, pausing environmental permits for facilities 50 MW or larger, citing rising utility bills, grid strain, and community impact. Texas has also recently moved to pause new approvals pending audits by its grid operator, reflecting reliability concerns. In Virginia, the heart of the country’s data center infrastructure, high-profile projects have been rejected or abandoned amid intense local opposition over land use and power consumption.
Another specific risk deserves attention here. The major cloud providers have booked very large remaining performance obligations (RPOs), future revenues underpinned by spending commitments, from the leading AI labs like OpenAI and Anthropic. The labs’ ability to honor those commitments rests, in turn, on end-customer demand continuing to grow quickly enough to justify them. But the dependency chain is more circular than it appears. A significant share of the capital flowing through the AI ecosystem is self-referential: chip makers guarantee obligations or invest directly in AI labs, which in turn buy or rent those same chips; cloud providers invest in the labs so that the labs can rent compute from them. The echo of the circular revenue flows that were exposed during the dot-com era (most notably at Global Crossing) is uncomfortable but hard to ignore. Should end-customer demand soften, or should just one or two of the heavily funded labs fail to list or raise capital at their suggested valuations, a portion of these obligations risk going unfulfilled. For the AI labs themselves, and especially for those preparing to IPO, the credibility of their revenue and spending forecasts would then come into question, and that is the kind of doubt that cascades quickly through the entire chain.
We would rather own the companies that prosper even if capital spending disappoints than those whose case rests on a shortage persisting.
This shapes how we select. We would rather own the companies that prosper even if capital spending disappoints, which is to say the share gainers, than those whose case rests on the persistence of a shortage. The shortage narrative is, in our view, already captured in the price, whereas the ability to take share is not.
Where we see the more durable opportunity is with the technology incumbents. The large cloud and software platforms, businesses such as Microsoft and Amazon, are capturing the end customer not by selling raw model capability but by wrapping it in genuine value for their clients. Their strength in cloud, the growth of their productivity software, and the market’s growing confidence that they will be enhanced by AI rather than disrupted by it all point in the same direction.
In Asia, similar logic applies further down the value chain. The leading consumer internet companies, whose scale and proprietary data make them natural beneficiaries of AI, stand to benefit in much the same way, yet the market has been far slower to recognize it. We had initially expected the baton to pass from AI enablers to adopters in H1 this year, but it is now clear this will take longer. The better-run companies are articulating how they intend to use AI, but translating intent into results takes time. For example, Alibaba is using AI tools to help merchants improve advertising ROI through better targeting of shoppers who have searched for relevant products. As merchants come to rely on these tools to allocate their advertising budgets efficiently, they grow more deeply embedded in Alibaba’s ecosystem, widening the gap between it and platforms that cannot match the same depth of data or targeting.
Historically extreme dispersion between winners and losers this year reinforces our conviction that a balanced portfolio, not a concentrated one, is what protects capital when markets move this fast.
From a risk perspective, we are comfortable with our technology exposure at roughly one third of the portfolio. That is below the benchmark, but the comparison is less meaningful than it appears: the benchmark is heavily skewed by a small number of mega cap names, notably TSMC and Samsung, whose weight reflects their market capitalization rather than the breadth of opportunity available. Our view is that the better value now accrues elsewhere. Technology has performed well, and a great deal of that earnings power is already in the price. On a longer-term, intrinsic-value basis, we see more compelling opportunities in other parts of the market.
If June and July carried a single lesson, it is that this market moves too rapidly and too indiscriminately for a concentrated portfolio to navigate safely. The episodes we have described in Korea and across the broader technology complex reinforced what we have long believed: that a balanced portfolio is not a concession to caution but a genuine source of resilience. When drawdowns arrive without warning and without regard for fundamentals, it is breadth and balance that protect capital and preserve the ability to act.
Consider the divergence between the IT and Consumer Discretionary sectors across Asia ex-Japan – in the first six months of this year, the gap in sector performance reached almost a 115 percentage points, with IT returning 93% and Consumer Discretionary falling 21%.12 Dispersions of that magnitude are exceptionally rare. Looking back through my career, comparable episodes can be counted on one hand: the dot-com bubble of 2000, the 2007-08 infrastructure cycle, and the COVID stay-at-home trade. Each was driven by the kind of concentrated, thematic momentum that eventually exhausted itself. History is also unambiguous about what follows: these gaps correct, and they tend to correct quickly, often within months once capital begins to rotate. We may already be seeing the early stages of that process now. By the end of July, the year-to-date divergence between IT and Consumer Discretionary had already narrowed to 78 percentage points.13
It’s also worth remembering that stocks don’t move up in a straight line. A number of our strongest performers from last year have corrected sharply on a year-to-date basis even as their operating momentum and earnings prospects remain fully intact. That pattern can test patience, but it does not trouble us. If anything, it reinforces our conviction that this is a portfolio that is rearing to go as leadership from the tech sector broadens from here.
Our task from here is straightforward: remain patient, stay balanced, and be ready to act when the market offers us the dislocations we have described. The portfolio is built for exactly that.
For sophisticated investors only. For informational purposes only. The information presented in the material is not, and may not be relied on in any manner as legal, tax, investment, accounting or other advice or as an offer to sell or a solicitation of an offer to buy an interest in any investment product or any other entity sponsored or managed by Shikhara Investment Management. This material doesn’t constitute and should not be considered as any form of financial opinion or recommendation.
This material is prepared by Shikhara Investment Management LP (“Shikhara”). This material does not constitute an offer to sell or the solicitation of an offer to buy in any state of the United States or other U.S. or non-U.S. jurisdiction to any person to whom it is unlawful to make such offer or solicitation in such state or jurisdiction.
Investment involves risk. Past performance is not indicative of future performance. It cannot be guaranteed that the performance of the investment product will generate a return, and there may be circumstances where no return is generated. Investors could lose all or a substantial portion of any investment made. Before making any investment decision, investors should read the Private Placement Memorandum for details and the risk factors. Investors should ensure they fully understand the risks associated with the investment product and should also consider their own investment objective and risk tolerance level. Investors are advised to seek independent professional advice before making any investment.
Shikhara’s investment products are suitable only for sophisticated investors and require the financial ability and willingness to accept the high risks and lack of liquidity inherent in Shikhara’s investment products. Prospective investors must be prepared to bear such risks for an indefinite period of time. No assurance can be given that the investment objectives of any given investment product will be achieved or that investors will receive a return of their investment.
Certain of the information contained in this material are statements of future expectations and other forward-looking statements. Views, opinions, and estimates may change without notice and are based on a number of assumptions which may or may not eventuate or prove to be accurate. Actual results, performance or events may differ materially from those in such statements.
Certain information contained in this material is compiled from third-party sources. The information and any opinions contained in this document have been obtained from sources that Shikhara considers reliable, but Shikhara does not represent that such information and opinions are accurate or complete, and thus should not be relied upon as such. Furthermore, all opinions are current only as of the date of distribution and are subject to change without notice. Shikhara does not have any obligation to provide revised opinions in the event of changed circumstances. Whereas Shikhara has, to the best of its endeavor, ensured that such information is accurate, complete, and up-to-date, and has taken care in accurately reproducing the information, Shikhara takes no responsibility for the accidental publication of incorrect information, nor for investment decisions taken based on this material. Neither Shikhara nor any of its affiliates makes any representation or warranty, express or implied, as to the accuracy or completeness of the information contained herein, and nothing contained herein should be relied upon as a promise or representation as to past or future performance of any investment product or any other entity.
The MSCI AC Asia ex Japan Index captures large and mid-cap representation across Developed Markets (DM) countries (excluding Japan) and Emerging Markets (EM) countries in Asia. The index covers approximately 85% of the free float-adjusted market capitalization in each country. The MSCI China Index captures large and mid-cap representation across China A shares, H shares, B shares, Red chips, P chips, and foreign listings (e.g. ADRs). The index covers about 85% of the Chinese equity universe.
The contents of this material are prepared and maintained by Shikhara and have not been reviewed by the Securities and Exchange Commission of the United States.
The Shikhara logo and name are trademarks of Shikhara Investment Management LP, registered in Hong Kong, the People’s Republic of China (PRC), Australia, the United Kingdom, the European Union, and the United States.

This website is published exclusively for the purpose of providing general information about the management services carried out by Shikhara Investment Management LP, Shikhara Capital (Hong Kong) Private Limited and its affiliates (collectively “Shikhara Investment Management” or “Shikhara”). The information presented on the website is not, and may not be relied on in any manner as legal, tax, investment, accounting, or other advice or as an offer to sell or a solicitation of an offer to buy an interest in any investment product or any other entity sponsored or managed by Shikhara Investment Management. This website doesn’t constitute and should not be considered as any form of financial opinion or recommendation.
Shikhara Investment Management LP is a Registered Investment Adviser with the U.S. Securities and Exchange Commission, and Shikhara Capital (Hong Kong) Private Limited is licensed by the Hong Kong Securities and Futures Commission. This website does not constitute an offer to sell or the solicitation of an offer to buy in any state of the United States or other U.S. or non-U.S. jurisdiction to any person to whom it is unlawful to make such offer or solicitation in such state or jurisdiction.
Investment involves risk. Past performance is not indicative of future performance. It cannot be guaranteed that the performance of the investment product will generate a return and there may be circumstances where no return is generated. Investors could lose all or a substantial portion of any investment made. Before making any investment decision, investors should read the Prospectus for details and the risk factors. Investors should ensure they fully understand the risks associated with the investment product and should also consider their own investment objective and risk tolerance level. Investors are advised to seek independent professional advice before making any investment.
Shikhara’s investment products are suitable only for sophisticated investors and require the financial ability and willingness to accept the high risks and lack of liquidity inherent in Shikhara’s investment products. Prospective investors must be prepared to bear such risks for an indefinite period of time. No assurance can be given that the investment objectives of any given investment product will be achieved or that investors will receive a return of their investment.
Certain of the information contained in this website are statements of future expectations and other forward-looking statements. Views, opinions, and estimates may change without notice and are based on a number of assumptions which may or may not eventuate or prove to be accurate. Actual results, performance, or events may differ materially from those in such statements.
Certain information contained in this website is compiled from third-party sources. Whereas Shikhara Investment Management has, to the best of its endeavor, ensured that such information is accurate, complete, and up-to-date, and has taken care in accurately reproducing the information, Shikhara Investment Management takes no responsibility for the accidental publication of incorrect information, nor for investment decisions taken based on this website. Neither Shikhara Investment Management nor any of its affiliates makes any representation or warranty, express or implied, as to the accuracy or completeness of the information contained herein, and nothing contained herein should be relied upon as a promise or representation as to past or future performance of any investment product or any other entity.
The contents of this website are prepared and maintained by Shikhara Investment Management and has not been reviewed by the Securities and Exchange Commission of the United States or the Securities and Futures Commission of Hong Kong.
The Shikhara logo and name are trademarks of Shikhara Investment Management LP, registered in Hong Kong, the People’s Republic of China (PRC), Australia, the United Kingdom, the European Union, and the United States.