
The traditional emerging market (EM) allocation is becoming an increasingly blunt instrument. Grouping Asia alongside Latin America (LatAm) and Eastern Europe, Middle East and Africa (EMEA), made sense when EMs moved largely in tandem, driven by common factors like dollar strength, commodity cycles, and risk appetite. But that coherence has faded. Today, the dispersion between regions reflects fundamentally different growth models and warrants a more deliberate approach to portfolio construction.
We believe that Asia-specific mandates offer superior risk-adjusted return potential in the coming cycle. Latin America remains primarily a terms-of-trade beneficiary, with equity market performance tied to commodity price swings rather than structural competitiveness. The region contains well-managed companies and pockets of genuine innovation, but the probability of sustained gains has diminished as fundamental competitiveness eroded relative to Asian peers. EMEA faces its own constraints, caught between European economic stagnation and the geopolitical complexities of the Middle East and Africa.
In this paper, we outline the case for why Asia’s development is diverging from the EM pack and why investors should favor structural growth stories over those dependent on cyclical commodity dynamics – potentially reducing the strategic value of broad EM exposure relative to focused Asian allocation.
Emerging market indices have undergone substantial changes over the past two decades. In the early 2000s, the MSCI Emerging Markets index featured relatively balanced regional representation, with LatAm, EMEA, and Asia each maintaining meaningful weightings. Today, Asia comprises 80% of the index, with China, India, Taiwan, and South Korea accounting for the majority of that allocation.
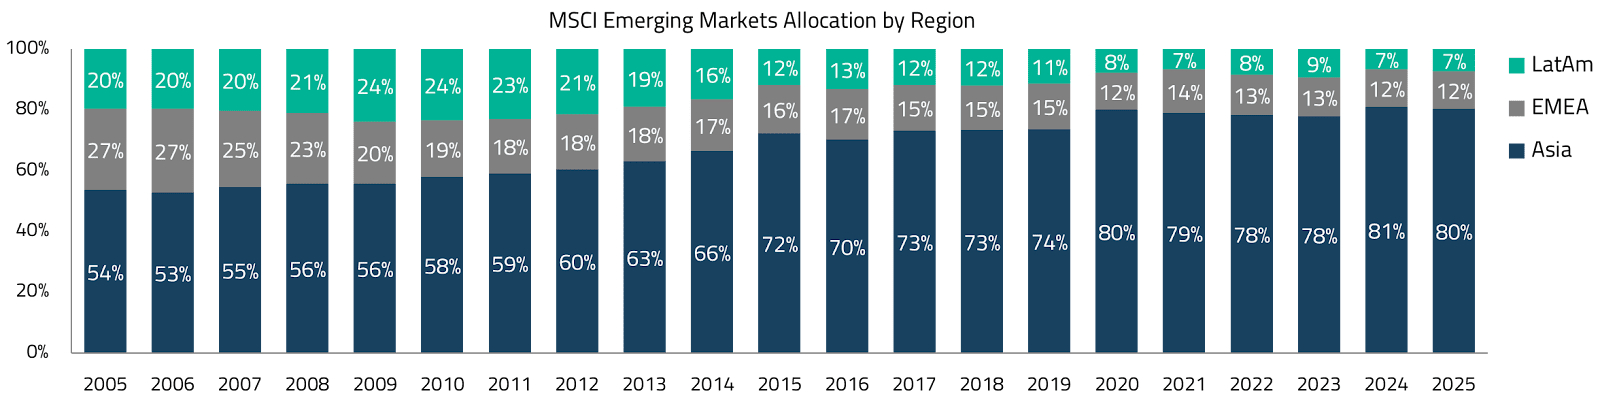
This shift carries important implications for EM investment strategies. Many institutional investors initially adopted broad EM approaches in the early 2000s, drawn by the opportunity to access multiple high-growth regions within a single allocation. As regional performance patterns diverged, however, allocation strategies became more selective. During the 2010s commodity downturn, many investors shifted toward Asia as LatAm and EMEA markets struggled. In the early 2020s, concerns about China’s regulatory changes and growth dynamics prompted some investors to return to broader EM exposure, seeking geographic diversification to manage concentration risk.
These evolving patterns raise a deeper strategic question: should investors continue treating “emerging markets” as a coherent asset class, or has the time come to make more deliberate regional distinctions? We are firmly in the camp of the latter, for several reasons.
Focusing on LatAm as the primary non-Asian component of EMs, we observe a region that has demonstrated periods of strong outperformance, but these successes have followed a distinctly cyclical pattern tied to commodity demand. During the 2003-2007 commodity supercycle, LatAm markets significantly outperformed Asian equities as China’s rapid industrialization drove unprecedented demand for the region’s natural resources – iron ore, copper, soybeans, and oil. This pattern repeated during the 2009-2011 post-financial crisis recovery, when quantitative easing and Chinese stimulus measures reignited commodity demand. Brazil, in particular, emerged as a standout performer during this period, benefiting from its position as a leading commodity exporter.
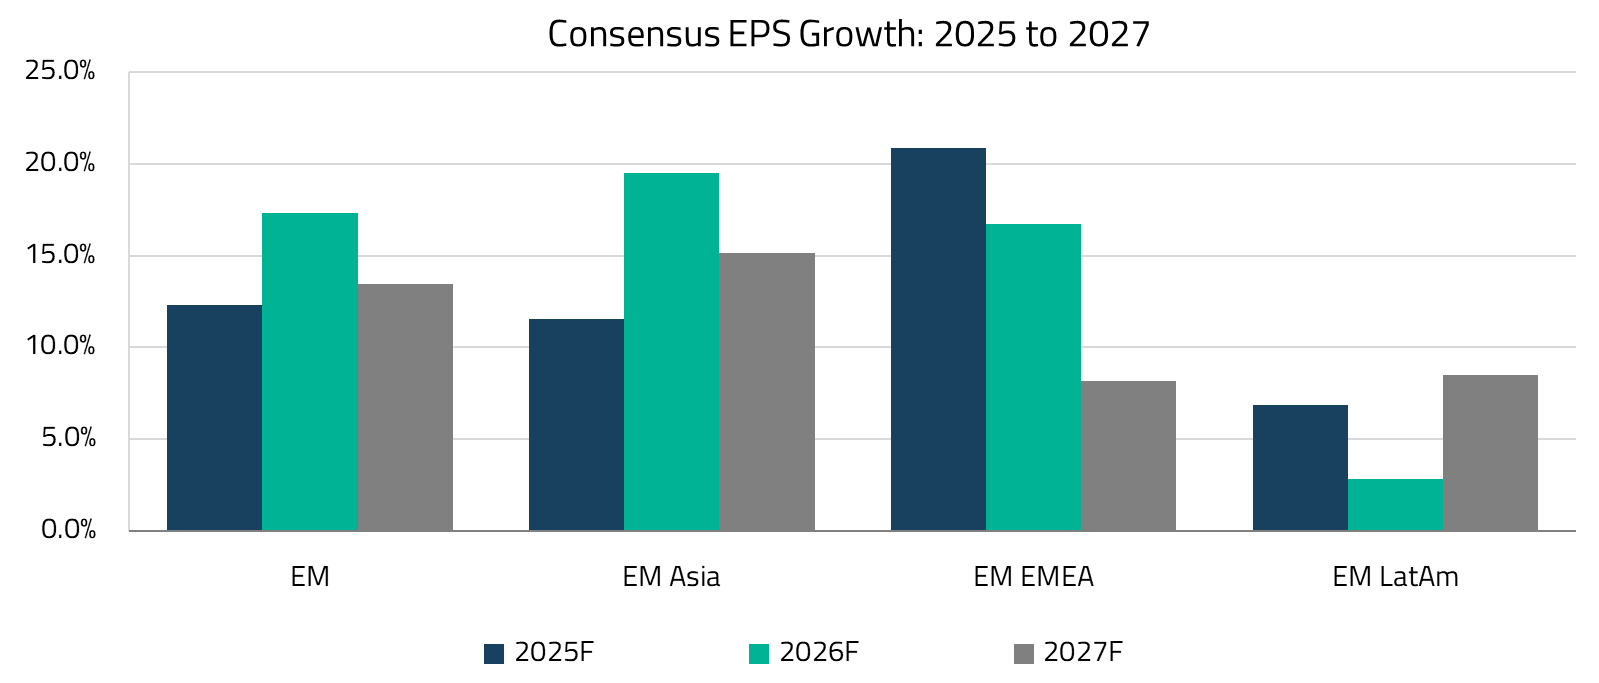
Similar dynamics have continued to drive LatAm performance during subsequent commodity rallies, including the 2016-2017 reflation trade following the Trump Administration’s first term (when expectations of US infrastructure spending boosted resource prices), and again during the 2021-early 2022 inflation surge amid post-COVID economic reopening. Even this year, LatAm markets have rebounded strongly, recovering from the 2024 currency depreciation and benefiting from the US Fed’s easing cycle. However, much of this rally is now reflected in valuations, and earnings expectations remain subdued for LatAm heading into 2026.
Overall, these outperformance periods have grown shorter and less pronounced over time. The fundamental challenge lies in the nature of LatAm’s growth drivers, which remain heavily tied to commodity cycles. This creates a pattern where LatAm experiences episodic success rather than sustained economic transformation and broad-based advancement.
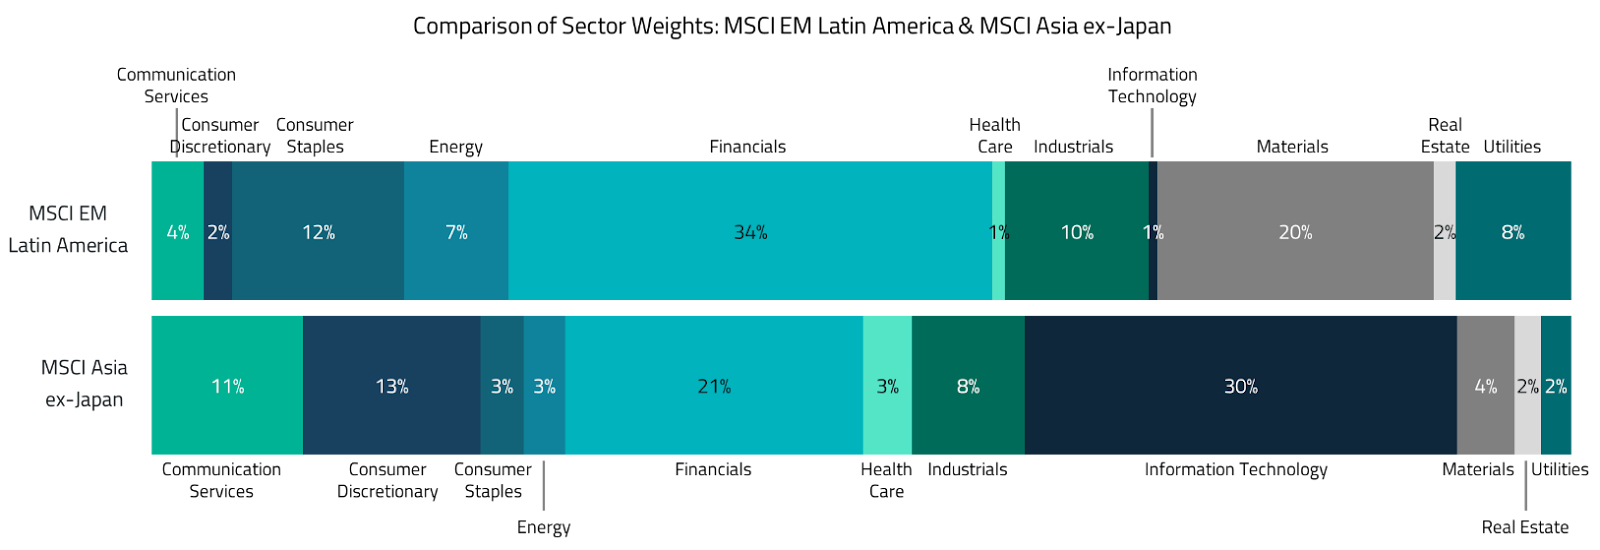
We see this in the sector composition of the MSCI EM Latin America index. Materials and Energy (sectors directly tied to commodity extraction) account for 27% of the index.1 Financials, the largest sector at 34%, is itself closely linked to commodity cycles through lending to miners, agribusiness, and trade finance. Meanwhile, Information Technology and Health Care represent just 1% each, leaving the region with minimal exposure to the secular growth themes that have driven global equity returns over the past decade. When commodity prices rise, LatAm outperforms; when they fall, there is little else to sustain momentum.
Asian markets, on the other hand, increasingly reflect longer-term structural trends, including technological advancement, demographic transitions, and industrial sophistication. But this wasn’t always the case.
Asia largely missed the first three industrial revolutions that defined modern economic advancement. During the steam powered First Industrial Revolution, most Asian nations were either under colonial rule or, like Japan and China, deliberately isolated from Western technological advances. The Second Industrial Revolution’s electricity and steel production similarly bypassed Asia, with only Japan successfully modernizing through the Meiji Restoration, while the rest of the continent remained economically peripheral. Even the early phases of the Third Industrial Revolution found Asia playing catch-up, though countries like Japan, Korea, and later China eventually became manufacturing powerhouses by the late 20th century.
Now, as we enter the Fourth Industrial Revolution, characterized by artificial intelligence (AI), robotics, and automation, the stakes for regional positioning have never been higher. Unlike previous revolutions where Asia started from behind, the region now possesses crucial advantages: advanced digital infrastructure, large technical talent pools, significant R&D capabilities, and manufacturing expertise. For investors, we think distinguishing between regions positioned to lead versus those to follow in this AI-driven industrial revolution will be critical for long-term returns.
The concept of regional development through competitive emulation drives fundamentally different outcomes across EM regions. Economist Kaname Akamatsu’s “flying geese” model describes how neighboring countries create an organized progression: as lead countries develop higher-tech industries, they relocate lower-value production to followers, creating a development ladder in which each nation moves up the value chain over time.
Asia exemplified this pattern perfectly. Japan served as the “lead goose”, developing advanced industries before passing lower-value manufacturing to Korea, Taiwan, and Singapore. As these countries advanced, China absorbed their earlier-stage production, while today India and Vietnam follow in China’s footsteps. This progression was driven by a mix of strategic emulation and market forces. Japan’s post-war investment in Southeast Asia, Korea and Taiwan’s systematic study of Japanese models, and China’s explicit examination of Asian development approaches under Deng Xiaoping all demonstrated a regional culture of learning from successful neighbors.
Latin America, by contrast, developed more as “scattered eagles” – powerful individually but lacking collective momentum. Brazil built massive automotive, steel, and petrochemical industries largely in isolation, focusing inward rather than integrating with neighbors. Mexico oriented toward NAFTA and US integration rather than regional development. Chile succeeded with copper exports and financial reforms but generated limited regional influence. Rather than sequential industrial handoffs, LatAm countries competed for similar commodity markets or pursued independent relationships with developed economies.
EMEA similarly failed to develop cohesive regional patterns. Resource-rich economies such as Russia and South Africa focused on oil and mineral exports without creating opportunities for industrial development. While Eastern Europe showed some flying geese characteristics through EU integration, this was driven by institutional frameworks rather than market-driven regional learning and remained limited in scale compared to Asia’s comprehensive development.
This fundamental difference in regional dynamics helps explain why Asia achieved sustained, coordinated growth while other emerging market regions experienced episodic, fragmented success.
The structural transformation underway across Asian economies creates compelling opportunities for the coming decade. The critical distinction between Asia and other emerging market regions lies not in growth rates or demographic trends, but in value capture. Across key categories, including consumption, technology, industrials, and healthcare, Asian companies are claiming an increasing share of global value chains, building competitive positions that are leaving their EM peers behind.
A remarkable shift is occurring in global consumer markets. For decades, Western multinationals have dominated growth in emerging-market consumption, capturing the rising spending power of Asian middle classes through established brands and distribution networks. That dynamic is reversing.
Chinese companies, forged in one of the world’s most competitive domestic markets, are now expanding aggressively beyond their borders. BYD, for example, has emerged as a formidable global competitor in electric vehicles (EVs), combining manufacturing scale with genuine technological innovation in battery systems. PDD’s Temu platform has disrupted Western e-commerce assumptions about price-value propositions. Meituan has developed operational capabilities in food delivery and local services that rival or exceed those of global peers. These companies didn’t succeed by copying Western models – they innovated under intense competitive pressure at home and are now applying those capabilities internationally.
This pattern echoes Korea’s trajectory a generation earlier, when Samsung, Hyundai, and LG evolved from domestic champions into global brands. The difference today is scale and speed. Chinese companies are expanding globally faster, across more categories, and with more sophisticated digital capabilities than their Korean predecessors.
The phenomenon extends beyond China. Sea Limited, headquartered in Singapore, has leveraged its Southeast Asian roots to build gaming, e-commerce, and fintech businesses spanning multiple continents, including LatAm. The common thread is Asian companies that have learned to operate profitably in demanding home markets (characterized by intense competition, price-sensitive consumers, and rapid technological adoption) and are now deploying those capabilities globally.
If AI represents the defining technology of the Fourth Industrial Revolution, Asia’s structural position is considerably stronger than in previous technological transitions. The region’s advantages are not merely about low-cost manufacturing but reflect genuine technological leadership and roles within global supply chains.
Taiwan and South Korea control critical chokepoints in semiconductor fabrication that cannot be easily replicated. TSMC’s dominance in advanced node manufacturing and Samsung Electronics and SK Hynix’s position in memory reflect decades of accumulated expertise, capital investment, and process refinement. As AI workloads demand increasingly sophisticated chips, the value captured by these semiconductor leaders continues to grow.
Beyond semiconductors, as we outlined in our paper on the AI value chain, Asian technology ecosystems encompass the full stack required for AI deployment: display technologies, precision components, battery systems, and the manufacturing expertise to produce AI-enabled devices at scale. When a new AI application moves from research prototype to mass-market product, Asian supply chains are indispensable.
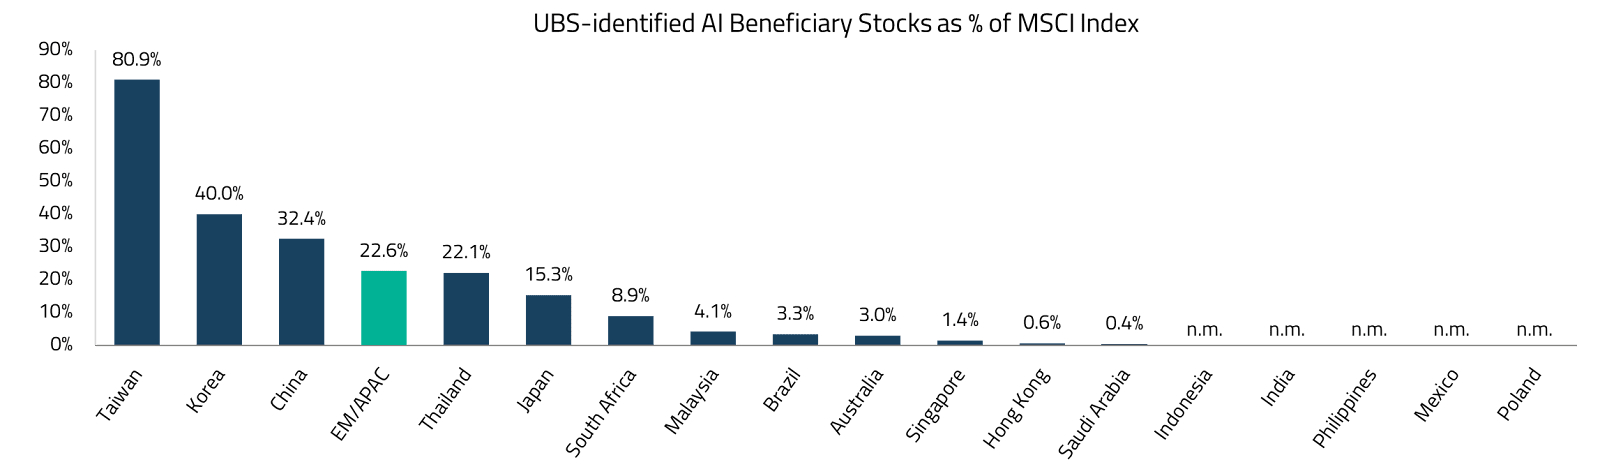
This is consistent with analysis from UBS, which identified Asian stocks as the most exposed to AI themes among EM/Asia Pacific (APAC) peers.
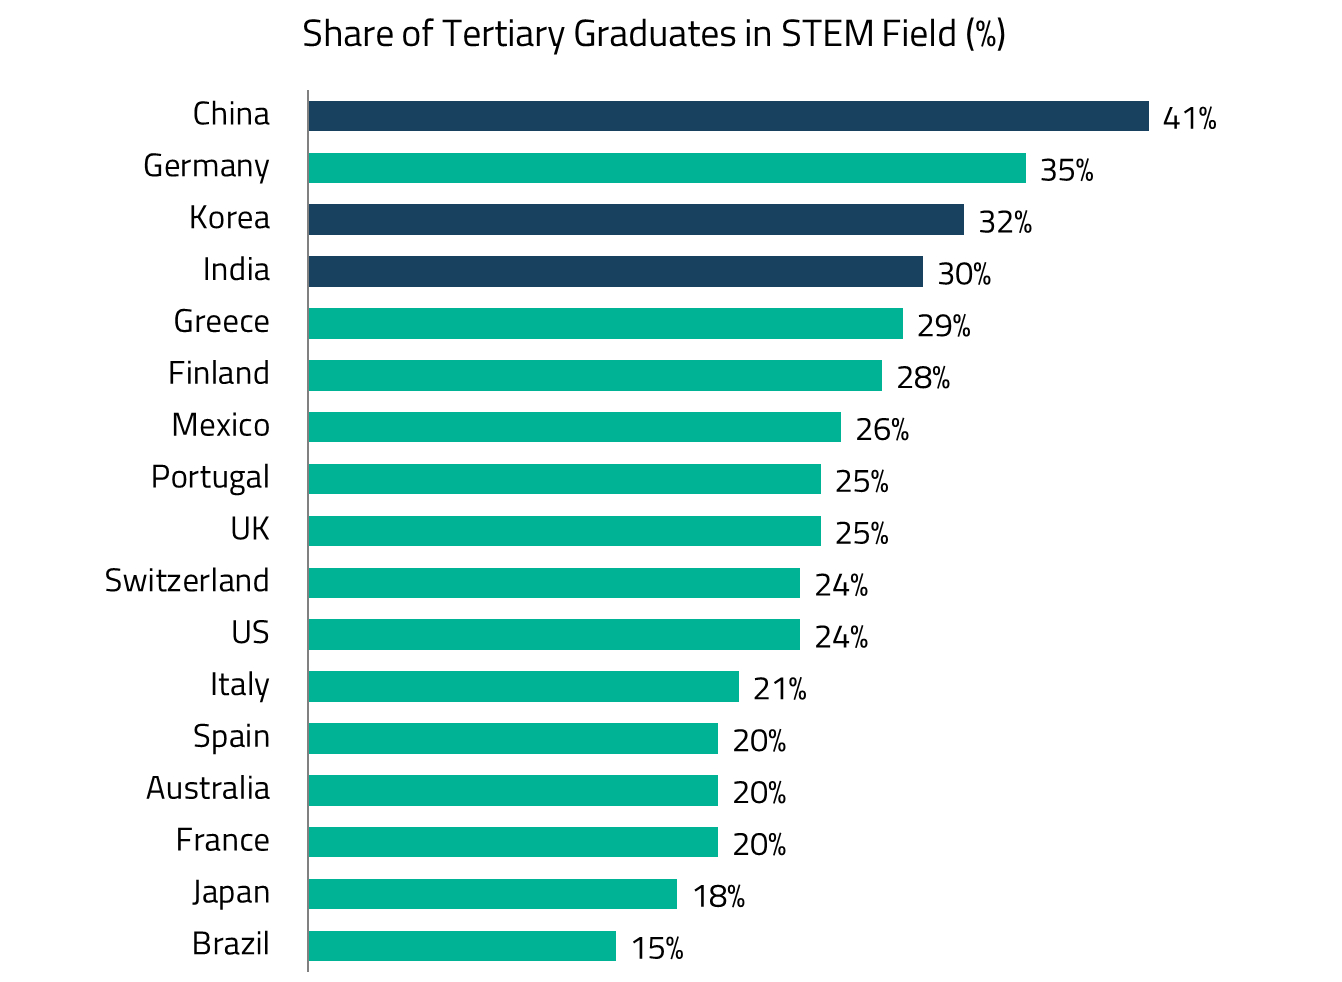
The region’s technical talent pool provides another structural advantage. Engineering and computer science graduates from institutions across China, India, Taiwan, and Korea feed into both domestic technology industries and global research centers. More than the sheer quantity, it reflects educational systems that have prioritized technical skills for decades and corporate cultures that invest heavily in R&D capabilities.
The reindustrialization efforts now underway across developed economies cannot succeed in isolation. As these nations pursue ambitious programs to rebuild domestic capacity, they confront a practical reality: the engineering expertise, manufacturing ecosystems, and project delivery capabilities required for large-scale industrial buildouts have migrated to Asia.
South Korean and Japanese industrial companies have emerged as essential partners in this transition. Unlike many Western economies that allowed heavy industrial ecosystems to atrophy, Korea and Japan preserved robust capabilities in shipbuilding, defense, power infrastructure, and precision manufacturing. We discuss this in our article on Asia’s role in the industrial revival.
In power grid infrastructure, the opportunity is particularly acute. Power demand in Europe peaked in 2008 and subsequently declined through successive crises, leaving transmission and distribution networks unprepared for the electrification trends and AI-driven demand growth now emerging. The US faces similar constraints, with its manufacturing capital stock declining nearly ten percentage points over three decades.2
Korean firms like HD Hyundai Electric have positioned themselves as preferred suppliers for critical grid equipment, having established a US manufacturing presence as early as 2011 and built relationships with utility companies that value their product knowledge, quality, and reliability. The company’s strong order backlog reflects the structural nature of this demand rather than cyclical opportunism.
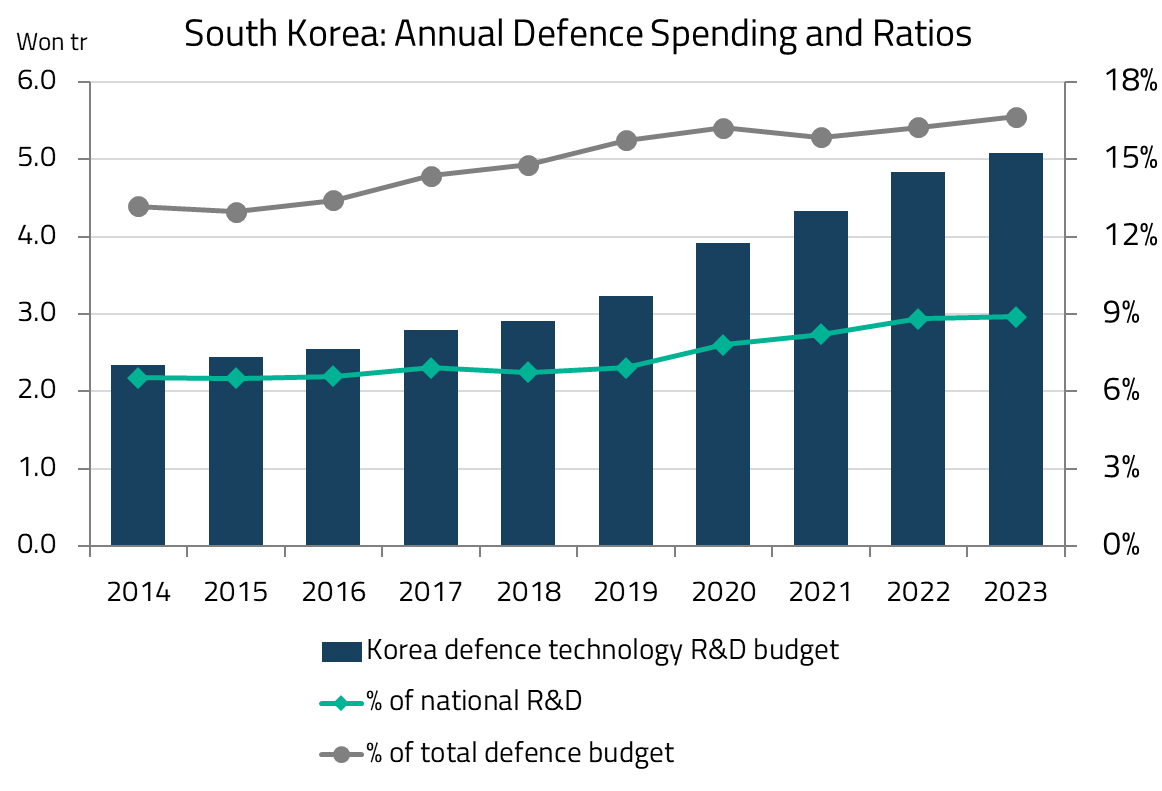
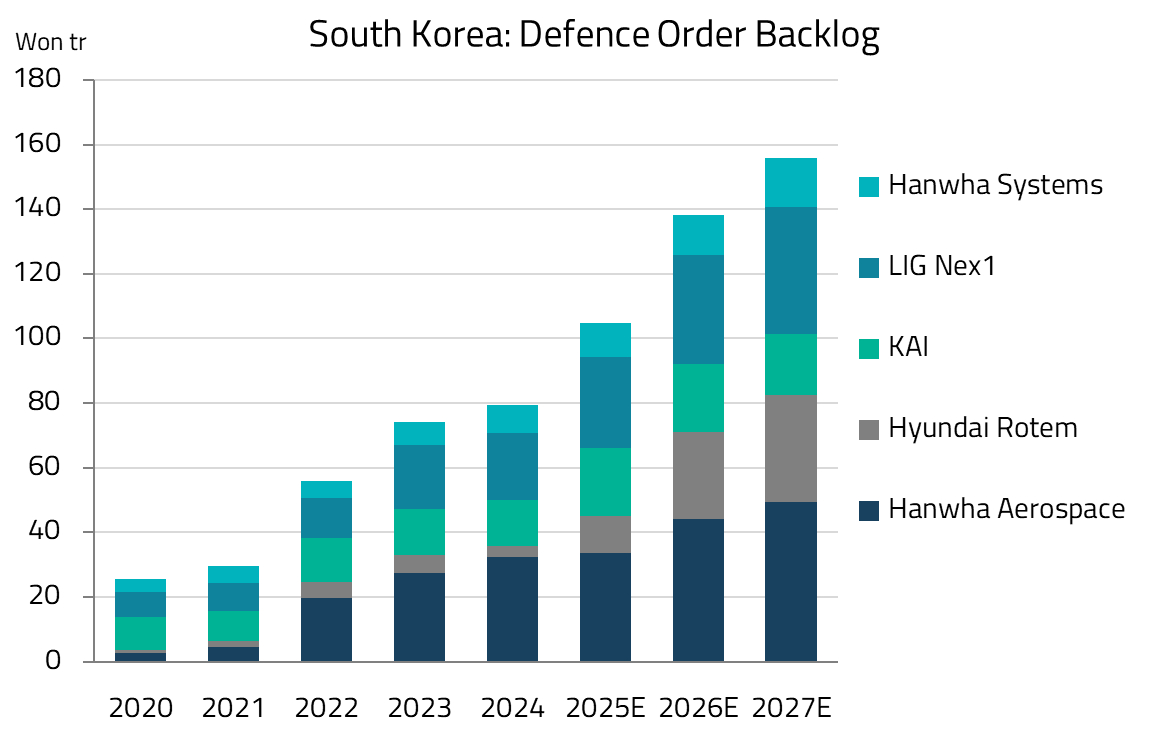
A similar dynamic is playing out in defense. Korea’s defense sector matured through decades of sustained investment driven by the security threat from North Korea, producing weapon systems that are both affordable and available with short lead times. Following Russia’s invasion of Ukraine in 2022, Poland (NATO’s eastern frontline state) signed framework agreements worth over USD 24 billion with Korean firms like Hanwha Aerospace and Korea Aerospace Industries.3 Unlike Western defense primes facing production bottlenecks and hesitating on technology transfer, Korean firms offer competitive price-performance, rapid delivery, and willingness to support local industrialization – precisely what European governments now prioritize as they urgently rebuild their defense capabilities.
Finally, India’s industrial base is the upcoming evolution, driven by the country’s positioning as a “China+1” destination in an increasingly multipolar industrial order. Engineering and infrastructure firms such as Larsen & Toubro and Kalpataru Projects have accumulated deep expertise through India’s own infrastructure buildout. Perhaps more instructive is how individual companies are leveraging industrial expertise to move up the value chain. Sansera Engineering, an Indian auto components manufacturer, exemplifies this trajectory. Having built precision manufacturing capabilities serving demanding automotive customers, the company is now expanding into aerospace components – a sector where quality requirements are even more stringent and margins substantially higher. This pattern of capability migration, from lower-value to higher-value applications, is something we observe repeatedly across leading Asian industrial companies.
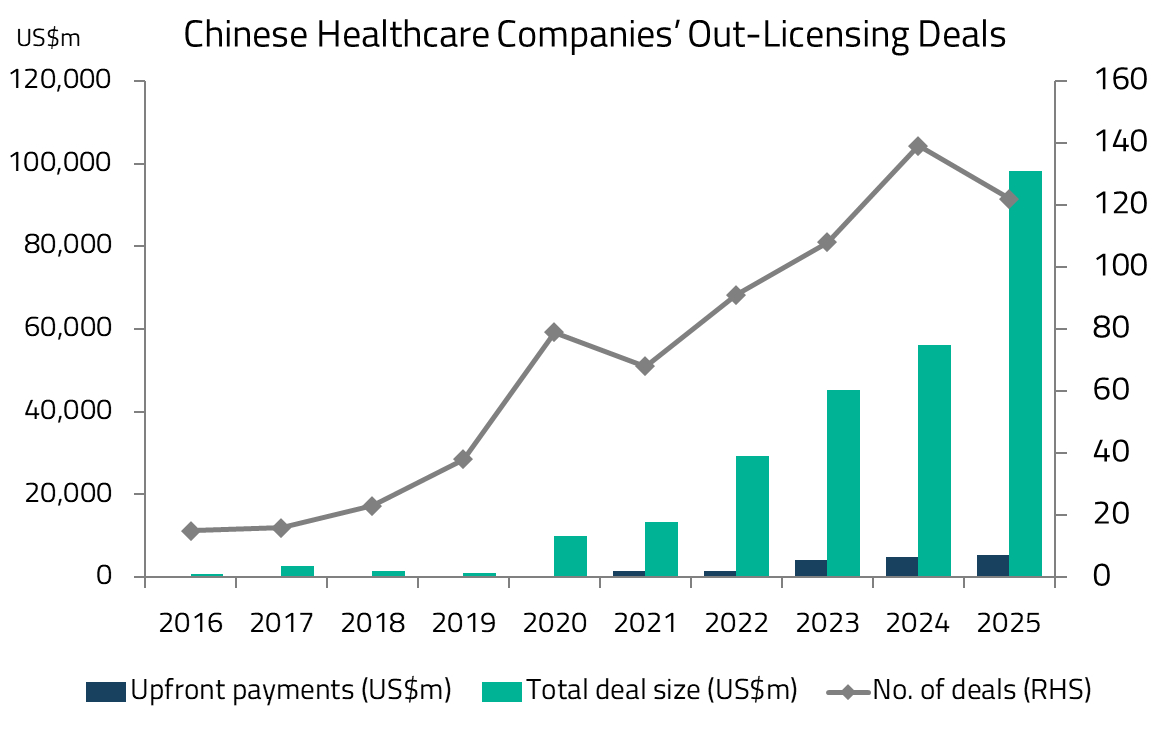
A less widely appreciated transformation is occurring in pharmaceutical innovation. For decades, Asian healthcare companies occupied peripheral positions in global drug development – manufacturing generic medicines or providing contract research services to Western pharmaceutical giants. That positioning is shifting.
Chinese biotechnology companies have executed a series of significant out-licensing deals with global pharmaceutical majors, monetizing domestically developed molecules and therapeutic platforms. These transactions signal recognition by Western pharma that genuine innovation is emerging from Chinese research organizations – not just manufacturing capability or clinical trial capacity, but novel drug candidates with global commercial potential.
This progression from low-end to high-end represents decades of deliberate capability building. Companies like Jiangsu Hengrui Pharmaceuticals and Hansoh Pharmaceutical initially established themselves through generic drug manufacturing and gradually moved up the value chain. Hengrui, founded in 1970 as a traditional pharmaceutical manufacturer, spent decades producing generics before investing heavily in R&D during the 2000s, eventually developing novel oncology drugs and anesthetics that gained domestic market share. Hansoh followed a similar trajectory, transitioning from a generic drug producer in the 1990s to developing innovative small molecules and biologics by the 2010s. The critical inflection came as these companies retained their most promising pipeline assets rather than immediately out-licensing them, instead building clinical development capabilities to advance candidates through Phase II or III trials, demonstrating proof-of-concept with robust data that commanded premium valuations in partnership negotiations.
A similar development is occurring in healthcare services, where Indian hospital chains are demonstrating that their operational models can succeed internationally. Narayana Health pioneered a high-volume, low-cost cardiac care model in India and has successfully exported this approach, establishing a 104-bed cardiac hospital in the Cayman Islands. More recently, the company announced the acquisition of Practice Plus Group Hospitals, the fifth largest private hospital group in the UK, to further expand its global healthcare reach.4 The acquisition provides Narayana with a platform to replicate its efficient, high-throughput model in the growing UK private healthcare market with increasing National Health Service (NHS) waiting lists.
India’s Global Capability Centers (GCCs) represent another dimension of Asia’s value capture that mirrors the progression from low- to high-end. What began as back-office cost arbitrage operations in the early 2000s has evolved into a USD 68 billion industry employing nearly 2.2 million professionals, with projections to reach up to USD 199 billion by 2030.5
The trajectory of these centers tells the same story of deliberate capability building. For example, executives at SAP Labs India made a decision to not operate as “an offshore center doing low-end jobs” but instead integrate its India development center into its four global R&D hubs, pioneering distributed research and development.6 Another is Microsoft’s India Development Center – established in Hyderabad in 1998, it is now Microsoft’s largest software development center outside Redmond, contributing to products including Azure, Windows, Office, Bing, and even playing a key role in building the Azure Supercomputer. Similarly, Mercedes-Benz Research and Development India has become the company’s largest R&D center outside Germany, with over 8,500 professionals, including engineers and data scientists, working on autonomous, connected, and EV technologies.7
The strategic significance for India extends beyond immediate economic contribution. These centers are cultivating a generation of engineers and researchers with exposure to cutting-edge global projects, creating knowledge spillovers that benefit the broader economy. This deep bench of talent, trained on world-class systems and processes, forms the foundation for India’s next wave of indigenous technology companies and entrepreneurs.
The traditional case for emerging market diversification rested on the ability to access multiple high-growth regions with differentiated return drivers. In practice, the non-Asian components of EM indices face structural headwinds that diminish their attractiveness as complements to Asian equity exposure.
Latin America’s historical outperformance periods coincided with commodity price surges, creating powerful but temporary returns. Looking forward, the dynamics that drove those rallies appear less likely to recur with similar force.
Central banks globally are operating with somewhat higher inflation levels than pre-pandemic, suggesting that the aggressive rate-cutting cycles that historically accompanied commodity recoveries may be shallower than investors expect. Even if commodities rally, the traditional transmission mechanism – lower rates stimulating growth and asset prices – may prove less powerful than in previous cycles.
More fundamentally, the structural demand drivers that powered the 2003-2011 commodity supercycle are unlikely to repeat. China’s economy has shifted decisively away from resource-intensive heavy industrialization toward consumption and services. No other economy offers a comparable scale to drive the next wave of commodity demand growth. This doesn’t preclude cyclical rallies in resource prices, but it does suggest that the sustained, multi-year commodity booms that drove exceptional LatAm returns are less likely going forward.
Economic development ultimately reflects accumulated policy choices over time. Asian economies, particularly during their high-growth phases, generally prioritized investment in education, infrastructure, and industrial capabilities. Governments made deliberate decisions to build productive capacity rather than distribute resources directly to citizens. The results of those choices are visible in today’s manufacturing ecosystems, technical talent pools, and corporate capabilities.
Several Latin American economies made different choices, emphasizing social transfers and consumption support over productive investment. Brazil’s fiscal trajectory illustrates this pattern – substantial resources directed toward social programs, creating political constituencies dependent on continued transfers while constraining investment in the capabilities that drive long-term growth.
These historical choices create path dependencies that are difficult to reverse. Governments facing fiscal constraints cannot easily redirect spending toward investment when significant portions of their budgets are committed to transfer programs. As AI and automation potentially displace lower-skilled employment, countries with limited fiscal flexibility may face pressure to expand social support rather than invest in workforce adaptation – a response that perpetuates rather than resolves the underlying challenge.
The intensifying strategic competition between the United States and China creates uncomfortable choices for economies that have benefited from relationships with both powers. Latin America has received substantial Chinese investment over the past two decades. Between 2005 and 2022, Chinese entities invested in over 228 infrastructure projects across the region, spanning energy, telecommunications, and transportation.8
Under a more assertive US posture demanding alignment from trading partners, this investment flow faces disruption. Chinese companies contemplating major capital commitments in Latin American ports, telecommunications infrastructure, or energy projects must now weigh geopolitical risks that didn’t exist a decade ago. US pressure on allies and partners to limit Chinese technology adoption, as seen in debates over Huawei’s 5G equipment, extends to investment decisions in strategically significant sectors.
For Latin American economies, this geopolitical tension creates a difficult position. Aligning closely with US preferences may sacrifice Chinese investment, which has been a significant contributor to growth. Maintaining Chinese relationships may invite US pressure or restrictions. This uncertainty itself discourages long-term capital commitments, as investors – both Chinese and Western – hesitate to deploy capital into an unclear geopolitical environment.
While opportunities are abundant, Asia is a collection of diverse markets, each with its own distinct risks that demand careful navigation.
The most significant concern for Asian equity investors centers on China – specifically, the risk that geopolitical tensions could trigger severe economic disruption or even a Russia-style exclusion from global markets.
China’s handling of trade tensions in recent years suggests a sophisticated understanding of interdependencies that constrain escalation. Unlike Russia, whose integration with Western economies is concentrated in energy exports, China occupies critical positions across multiple supply chains, including rare earth processing, pharmaceutical precursors, electronics manufacturing, and numerous industrial components. Rapid decoupling would impose substantial costs on all parties.
The more probable trajectory involves gradual, selective disentanglement rather than abrupt separation. Western economies will prioritize domestic production capacity for the most strategically sensitive sectors, including advanced semiconductors, critical pharmaceuticals, and certain defense-related components. This process is already underway and is likely to result in approximately 30-40% of currently imported goods being produced domestically in developed markets over time.
For investors, this suggests a nuanced approach rather than taking binary bets. Chinese companies serving domestic consumption, operating in sectors less subject to strategic concerns, or possessing genuine technological advantages may navigate geopolitical tensions more easily.
China’s economic growth has decelerated from the exceptional rates of previous decades, prompting questions about whether the investment case remains compelling. Historical comparisons offer a useful perspective.
Japan’s economy slowed dramatically after its asset bubble burst in the early 1990s, yet Japanese equities continued to offer attractive opportunities throughout subsequent decades. Company-level fundamentals – governance improvements, capital allocation discipline, genuine innovation – mattered more than aggregate GDP growth. Investors who approached Japan with bottom-up discipline rather than macro pessimism identified substantial opportunities during what was supposedly a “lost” period.
China’s trajectory may prove similar. Aggregate growth rates will moderate, but the economy’s sheer scale ensures that even slower growth generates substantial absolute demand expansion. Companies that gain market share, improve profitability, or expand into new categories can deliver attractive returns even as headline GDP growth disappoints. The key is selectivity – identifying businesses with genuine competitive advantages rather than relying on macroeconomic tailwinds to lift all boats.
India’s demographic dividend is often cited as a key investment thesis; however, concerns exist that AI could turn this advantage into a burden. The concern is understandable considering India’s USD 250 billion IT and business process outsourcing industry employs over 5.4 million people.9
However, we think this focus on job destruction misses the broader transformation underway in India. The convergence of digital and physical infrastructure is creating vast new opportunities across India’s smaller cities. Tier 2 and Tier 3 cities now account for over 60% of e-commerce shipments and drive the majority of new customer growth – nearly 60% of new online shoppers since 2020 have emerged from Tier 3 and smaller cities.10 Platforms like Meesho, with more than 65% of their 15 million sellers from Tier 2 and 3 cities, have transformed market access for local entrepreneurs.11 A textile producer in Tirupur or a handicraft maker in Jaipur now accesses customers across India’s 1.4 billion population. This expansion creates employment opportunities in logistics, warehousing, and delivery roles that require physical presence, which AI cannot replicate.
For global equity allocators, the question is not merely “Asia or EM” but how Asian exposure fits within a comprehensive portfolio framework. Dedicated Asia mandates offer several advantages over broad EM approaches. Portfolio managers can develop deeper expertise when focused on a coherent region rather than spanning markets from São Paulo to Seoul, and the Investment Team can concentrate on a more navigable universe of companies.
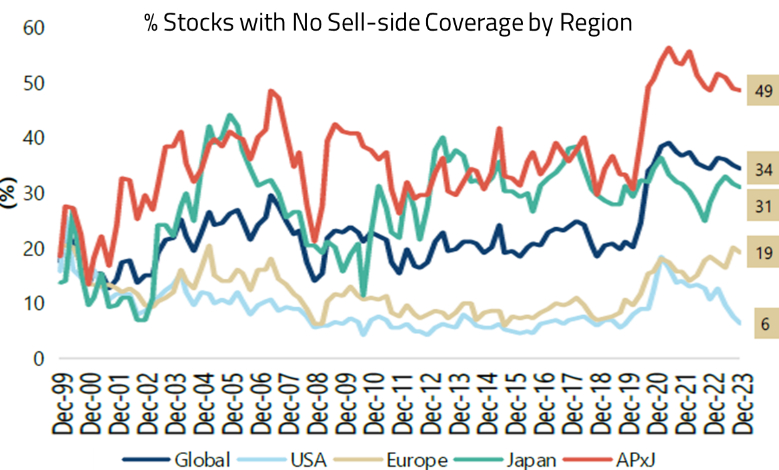
The dispersion of returns within Asian markets further strengthens the case for active management. Unlike US large-cap equities, where market efficiency and index concentration pose challenges for active managers, Asian markets exhibit wider valuation ranges, less analyst coverage of smaller companies, and greater variation in corporate governance and capital allocation quality. These characteristics reward fundamental research.
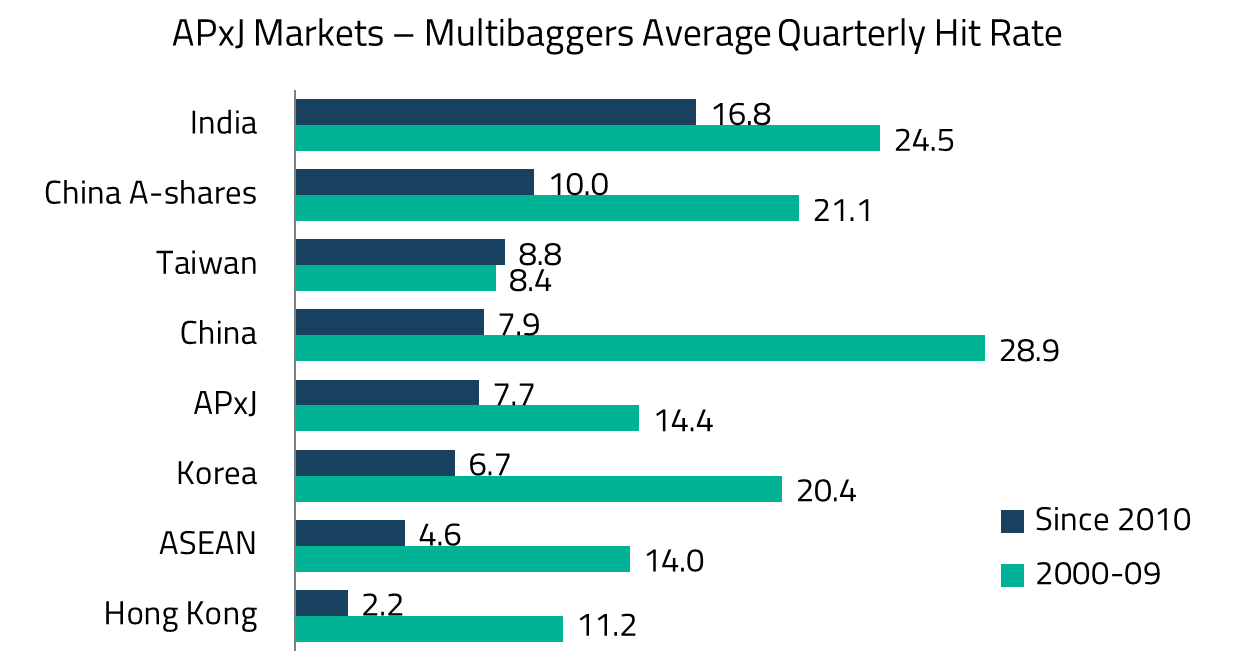
Investors who can distinguish between companies with genuine competitive advantages and those benefiting merely from cyclical tailwinds can add meaningful value. Information advantages persist longer in markets with less comprehensive coverage, while governance improvements and capital allocation shifts (identified early through direct company engagement) provide alpha sources largely absent in more efficient markets. We’ve seen this time and again in markets like China and India, which have produced the most multibaggers in the region since 2010.
Historically, we also see the case for dedicated Asia exposure supported by quantitative analysis. Examining optimal portfolio allocations across the S&P 500, MSCI Asia ex-Japan, and MSCI EM Latin America over the past 15 years, we find that Asia has been a far more consistent contributor to portfolio efficiency than Latin America.
Using mean-variance optimization, we constructed portfolios along the efficient frontier by setting target return levels and solving for the weights that minimize volatility at each level. At nearly every target return, the optimizer favored Asia over Latin America. Even in the minimum variance portfolio (highlighted in grey below), Asia held a larger weight, signaling its superior diversification properties. Latin America only dominated when targeting returns at or below the risk-free rate, which no investor would realistically choose.
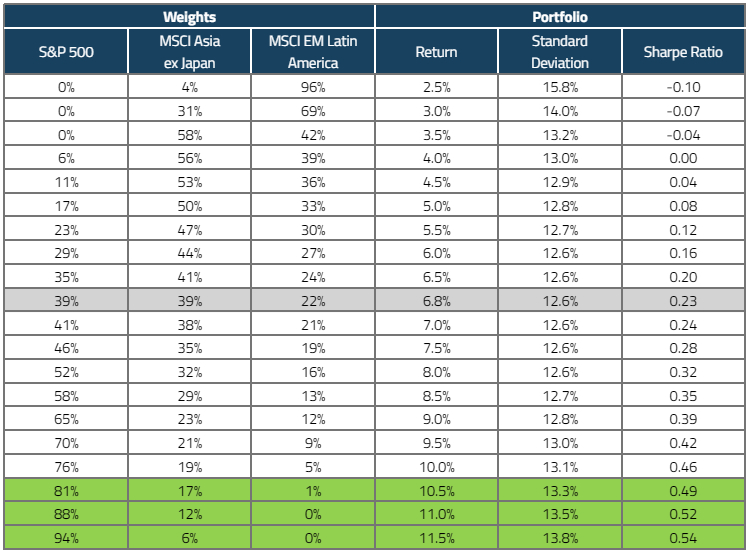
The efficient frontier also reveals an asymmetry worth noting. In the table above, as we move away from the minimum variance portfolio toward the green rows with higher return targets, the Sharpe ratio improves substantially (from 0.23 to 0.54), while volatility increases only modestly (from 12.6% to 13.8%). This improvement is largely driven by a reduction in exposure to Latin America alongside a sustained allocation to Asia ex-Japan, which continues to provide diversification benefits relative to the S&P 500.
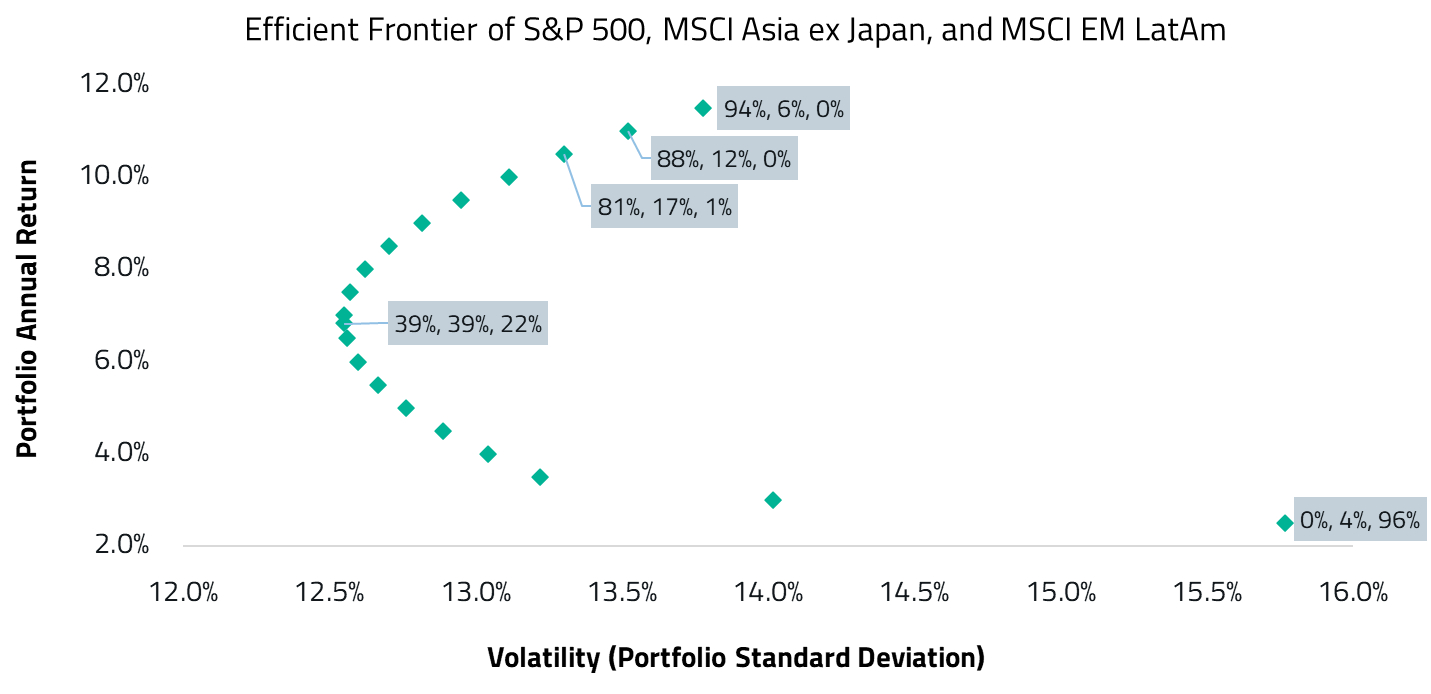
In practical terms, the frontier suggests that tilting toward Asia and away from Latin America has been a more efficient way for US investors to improve portfolio outcomes. Asia ex-Japan has tended to contribute meaningfully to returns while anchoring overall portfolio volatility, whereas Latin America has more often acted as a high volatility return lever that increases risk faster than it improves diversification. The implication is not that Latin America lacks return potential, but that Asia ex-Japan has historically been the more effective strategic allocation for improving risk-adjusted returns.
For sophisticated investors only. For informational purposes only. The information presented in the material is not and may not be relied on in any manner as legal, tax, investment, accounting or other advice or as an offer to sell or a solicitation of an offer to buy an interest in any investment product or any other entity sponsored or managed by Shikhara Investment Management. This material doesn’t constitute and should not be considered as any form of financial opinion or recommendation.
Shikhara Investment Management LP (“Shikhara”) is currently an Exempt Reporting Adviser that is exempt from registration as an investment adviser with the U.S. Securities and Exchange Commission. This material does not constitute an offer to sell or the solicitation of an offer to buy in any state of the United States or other U.S. or non-U.S. jurisdiction to any person to whom it is unlawful to make such offer or solicitation in such state or jurisdiction.
Investment involves risk. Past performance is not indicative of future performance. It cannot be guaranteed that the performance of the investment product will generate a return and there may be circumstances where no return is generated. Investors could lose all or a substantial portion of any investment made. Before making any investment decision, investors should read the Prospectus for details and the risk factors. Investors should ensure they fully understand the risks associated with the investment product and should also consider their own investment objective and risk tolerance level. Investors are advised to seek independent professional advice before making any investment.
Shikhara’s investment products are suitable only for sophisticated investors and require the financial ability and willingness to accept the high risks and lack of liquidity inherent in Shikhara’s investment products. Prospective investors must be prepared to bear such risks for an indefinite period of time. No assurance can be given that the investment objectives of any given investment product will be achieved or that investors will receive a return of their investment.
Certain of the information contained in this material are statements of future expectations and other forward-looking statements. Views, opinions and estimates may change without notice and are based on a number of assumptions which may or may not eventuate or prove to be accurate. Actual results, performance or events may differ materially from those in such statements.
Certain information contained in this material is compiled from third-party sources. The information and any opinions contained in this document have been obtained from sources that Shikhara considers reliable, but Shikhara does not represent such information and opinions are accurate or complete, and thus should not be relied upon as such. Furthermore, all opinions are current only as of the date of distribution are subject to change without notice. Shikhara does not have any obligation to provide revised opinions in the event of changed circumstances. Whereas Shikhara has, to the best of its endeavor, ensured that such, information is accurate, complete and up-to-date, and has taken care in accurately reproducing the information, Shikhara takes no responsibility for the accidental publication of incorrect information, nor for investment decisions taken based on this material. Neither Shikhara nor any of its affiliates makes any representation or warranty, express or implied, as to the accuracy or completeness of the information contained herein, and nothing contained herein should be relied upon as a promise or representation as to past or future performance of any investment product or any other entity.
The contents of this material are prepared and maintained by Shikhara and has not been reviewed by the Securities and Exchange Commission of the United States.
This website is published exclusively for the purpose of providing general information about the management services carried out by Shikhara Investment Management LP, Shikhara Capital (Hong Kong) Private Limited and its affiliates (collectively “Shikhara Investment Management” or “Shikhara”). The information presented on the website is not, and may not be relied on in any manner as legal, tax, investment, accounting, or other advice or as an offer to sell or a solicitation of an offer to buy an interest in any investment product or any other entity sponsored or managed by Shikhara Investment Management. This website doesn’t constitute and should not be considered as any form of financial opinion or recommendation.
Shikhara Investment Management LP is currently an Exempt Reporting Adviser that is exempt from registration as an investment adviser with the U.S. Securities and Exchange Commission and Shikhara Capital (Hong Kong) Private Limited has been approved by the Hong Kong Securities and Futures Commission. This website does not constitute an offer to sell or the solicitation of an offer to buy in any state of the United States or other U.S. or non-U.S. jurisdiction to any person to whom it is unlawful to make such offer or solicitation in such state or jurisdiction.
Investment involves risk. Past performance is not indicative of future performance. It cannot be guaranteed that the performance of the investment product will generate a return and there may be circumstances where no return is generated. Investors could lose all or a substantial portion of any investment made. Before making any investment decision, investors should read the Prospectus for details and the risk factors. Investors should ensure they fully understand the risks associated with the investment product and should also consider their own investment objective and risk tolerance level. Investors are advised to seek independent professional advice before making any investment.
Shikhara’s investment products are suitable only for sophisticated investors and require the financial ability and willingness to accept the high risks and lack of liquidity inherent in Shikhara’s investment products. Prospective investors must be prepared to bear such risks for an indefinite period of time. No assurance can be given that the investment objectives of any given investment product will be achieved or that investors will receive a return of their investment.
Certain of the information contained in this website are statements of future expectations and other forward-looking statements. Views, opinions, and estimates may change without notice and are based on a number of assumptions which may or may not eventuate or prove to be accurate. Actual results, performance, or events may differ materially from those in such statements.
Certain information contained in this website is compiled from third-party sources. Whereas Shikhara Investment Management has, to the best of its endeavor, ensured that such information is accurate, complete, and up-to-date, and has taken care in accurately reproducing the information, Shikhara Investment Management takes no responsibility for the accidental publication of incorrect information, nor for investment decisions taken based on this website. Neither Shikhara Investment Management nor any of its affiliates makes any representation or warranty, express or implied, as to the accuracy or completeness of the information contained herein, and nothing contained herein should be relied upon as a promise or representation as to past or future performance of any investment product or any other entity.
The contents of this website are prepared and maintained by Shikhara Investment Management and has not been reviewed by the Securities and Exchange Commission of the United States or the Securities and Futures Commission of Hong Kong.
The Shikhara logo and name are trademarks of Shikhara Investment Management LP, registered in Hong Kong, the People’s Republic of China (PRC), Australia, the United Kingdom, the European Union, and the United States.